

Answered step by step
Verified Expert Solution
Question
1 Approved Answer
QUESTION 2 3 A p - chart is used to monitor the fraction of defectives in the output of a process. True False QUESTION 2
QUESTION
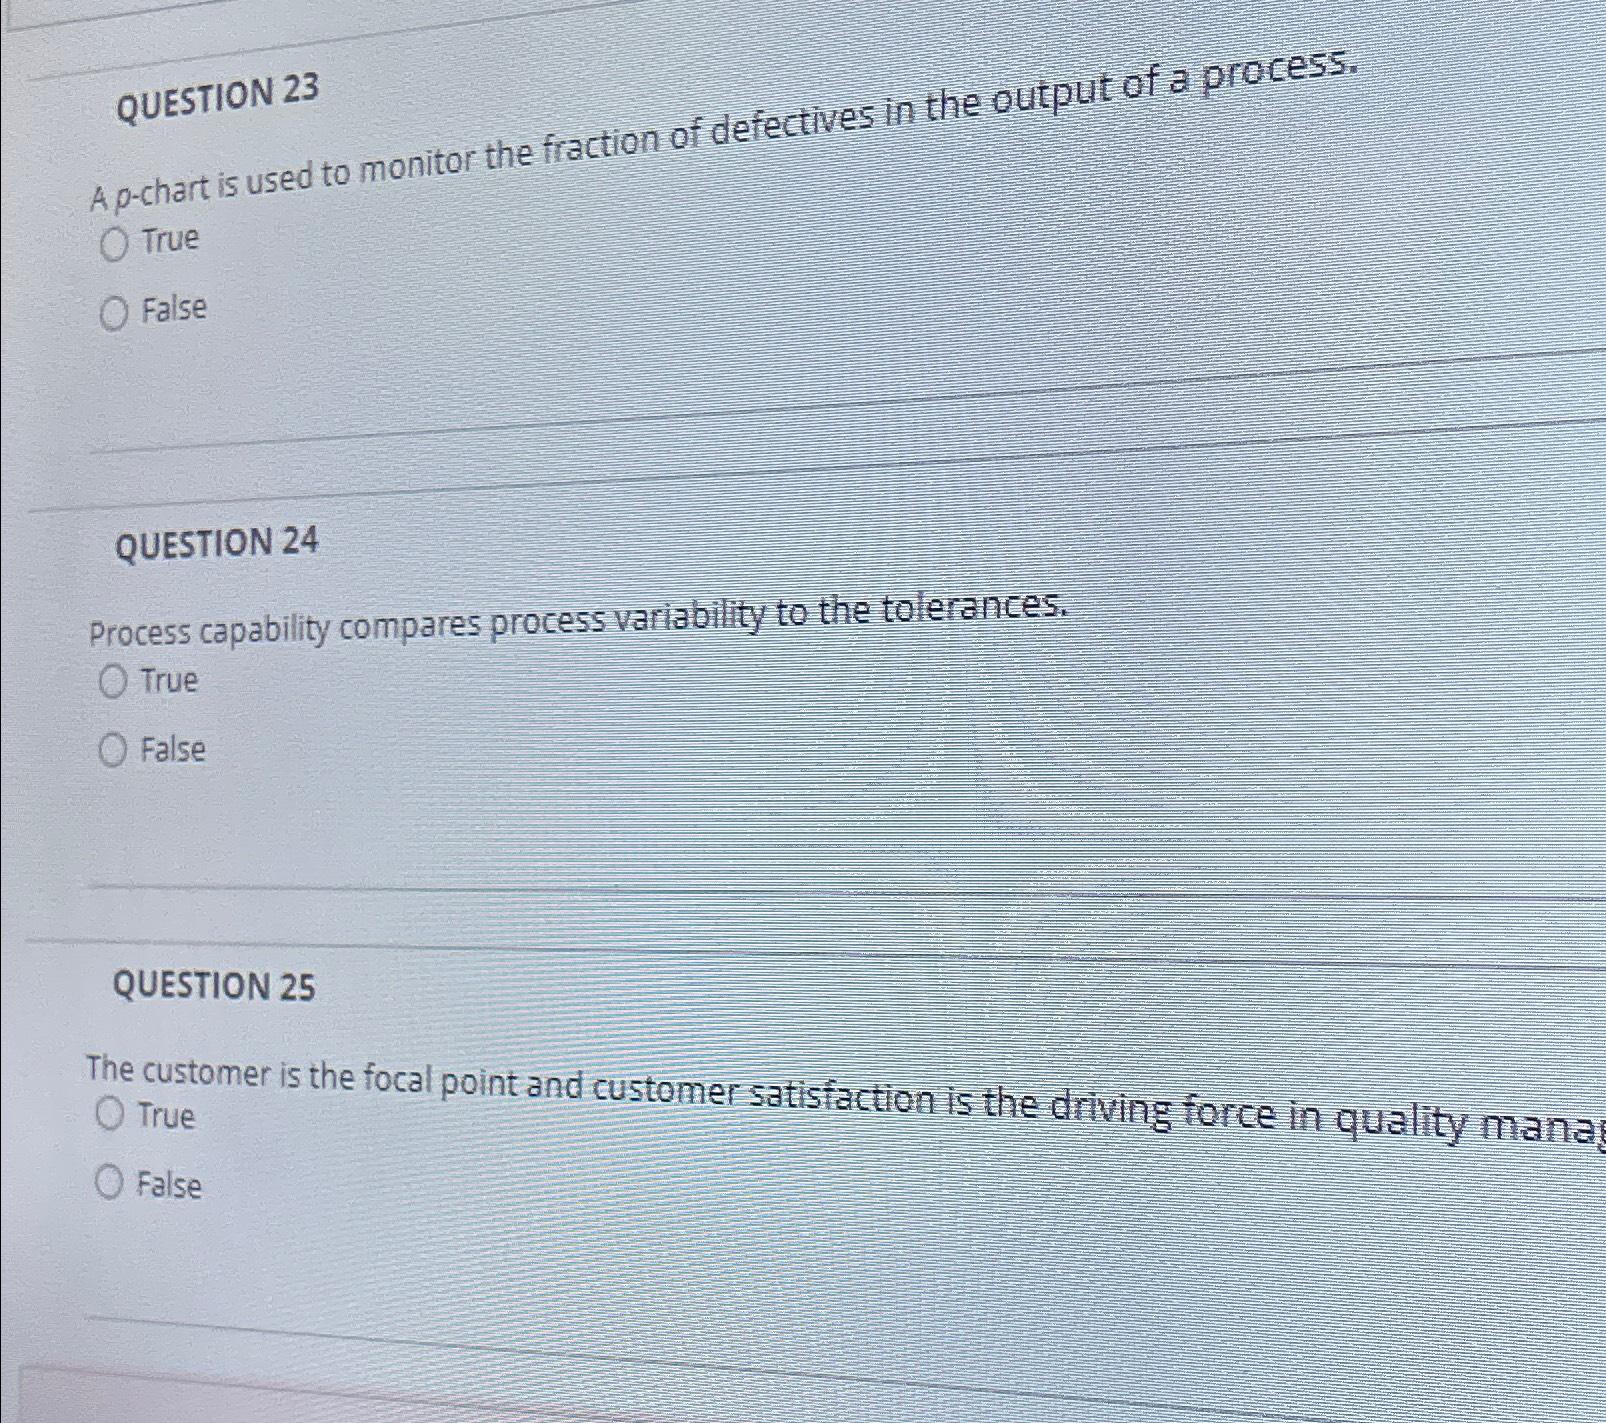
A pchart is used to monitor the fraction of defectives in the output of a process.
True
False
QUESTION
Process capability compares process variability to the tolerances.
True
False
QUESTION
The customer is the focal point and customer satisfaction is the driving force in quality mana True
False
Step by Step Solution
There are 3 Steps involved in it
Step: 1

Get Instant Access to Expert-Tailored Solutions
See step-by-step solutions with expert insights and AI powered tools for academic success
Step: 2

Step: 3
Ace Your Homework with AI
Get the answers you need in no time with our AI-driven, step-by-step assistance
Get Started
THE Classroom Management Book
Authors: Harry K. Wong, Rosemary T. Wong, Sarah F. Jondahl, Oretha F. Ferguson
1st Edition
9780976423331