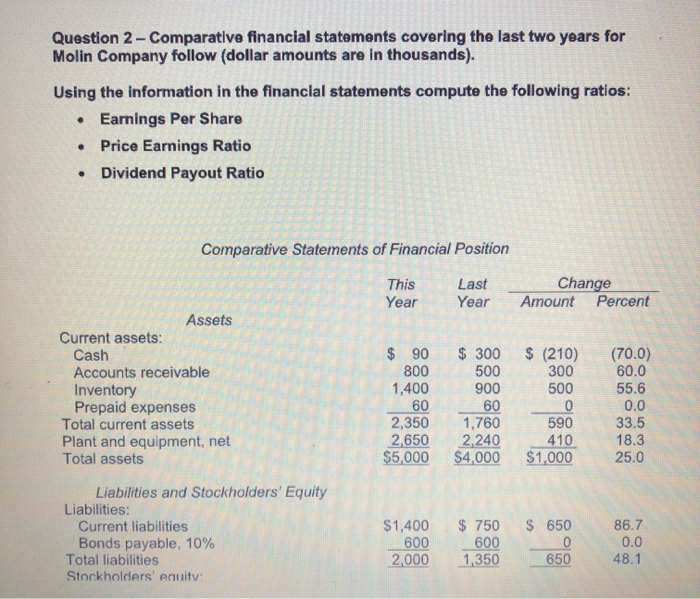
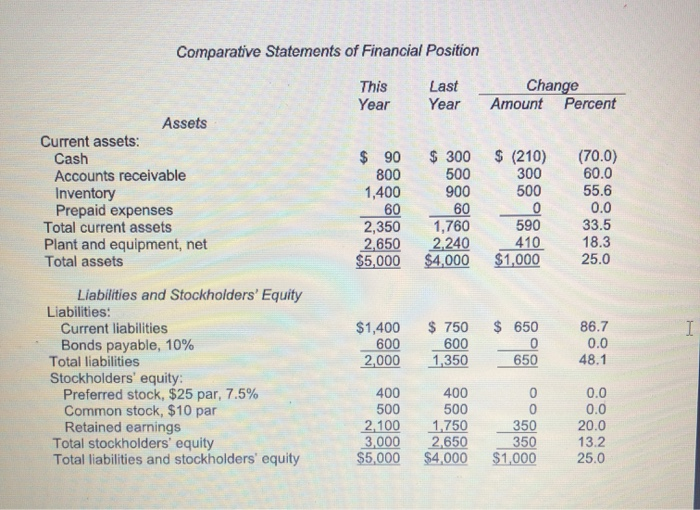
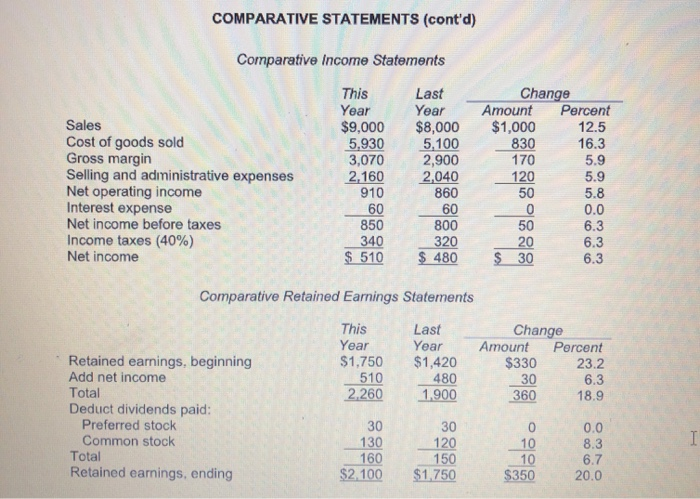
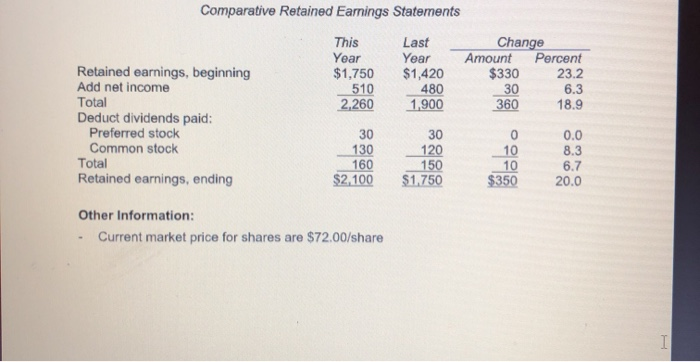
Question 2 - Comparative financial statements covering the last two years for Molin Company follow (dollar amounts are in thousands). Using the information in the financial statements compute the following ratios: Earnings Per Share Price Earnings Ratio Dividend Payout Ratio . Comparative Statements of Financial Position This Year Last Year Change Amount Percent Assets Current assets: Cash Accounts receivable Inventory Prepaid expenses Total current assets Plant and equipment, net Total assets $ (210) 300 500 $ 90 $ 300 800 500 1,400 900 60 60 2,350 1,760 2,650 2,240 $5,000 $4,000 0 (70.0) 60.0 55.6 0.0 33.5 18.3 25.0 590 410 $1,000 Liabilities and Stockholders' Equity Liabilities: Current liabilities Bonds payable, 10% Total liabilities Stockholders' equitv: $1,400 600 2,000 $ 750 600 1,350 $ 650 0 650 86.7 0.0 48.1 Comparative Statements of Financial Position This Year Last Year Change Amount Percent $ 90 800 1,400 60 2,350 2,650 $5,000 $ 300 500 900 60 1,760 2.240 $4,000 $ (210) 300 500 0 590 410 $1,000 (70.0) 60.0 55.6 0.0 33.5 18.3 25.0 Assets Current assets: Cash Accounts receivable Inventory Prepaid expenses Total current assets Plant and equipment, net Total assets Liabilities and Stockholders' Equity Liabilities: Current liabilities Bonds payable, 10% Total liabilities Stockholders' equity: Preferred stock, $25 par, 7.5% Common stock, $10 par Retained earnings Total stockholders' equity Total liabilities and stockholders' equity I $1,400 600 2,000 $ 750 600 1,350 $ 650 0 650 86.7 0.0 48.1 400 500 2.100 3,000 $5,000 400 500 1,750 2,650 $4,000 0 0 350 350 $1,000 0.0 0.0 20.0 13.2 25.0 COMPARATIVE STATEMENTS (cont'd) Comparative Income Statements Sales Cost of goods sold Gross margin Selling and administrative expenses Net operating income Interest expense Net income before taxes Income taxes (40%) Net income This Year $9,000 5,930 3,070 2,160 910 60 850 340 $ 510 Last Year $8,000 5,100 2,900 2,040 860 60 800 320 $ 480 Change Amount Percent $1,000 12.5 830 16.3 170 5.9 120 5.9 50 5.8 0 0.0 50 6.3 20 6.3 $ 30 6.3 Comparative Retained Earnings Statements This Year $1,750 510 2.260 Last Year $1,420 480 1.900 Change Amount Percent $330 23.2 30 6.3 360 18.9 Retained earnings, beginning Add net income Total Deduct dividends paid: Preferred stock Common stock Total Retained earnings, ending I 30 130 160 $2.100 30 120 150 $1,750 0 10 10 S350 0.0 8.3 6.7 20.0 Comparative Retained Earings Statements This Year $1,750 510 2,260 Last Year $1,420 480 1,900 Change Amount Percent $330 23.2 30 6.3 360 18.9 Retained earnings, beginning Add net income Total Deduct dividends paid: Preferred stock Common stock Total Retained earnings, ending 30 130 160 $2,100 30 120 150 $1,750 0 10 10 $350 0.0 8.3 6.7 20.0 Other Information: Current market price for shares are $72.00/share
