

Answered step by step
Verified Expert Solution
Question
1 Approved Answer
QUESTION 2 FINANCE (30) 2.1 Use the information provided below to calculate the following ratios and interpret them over the two-year period (2017-2018) taking into
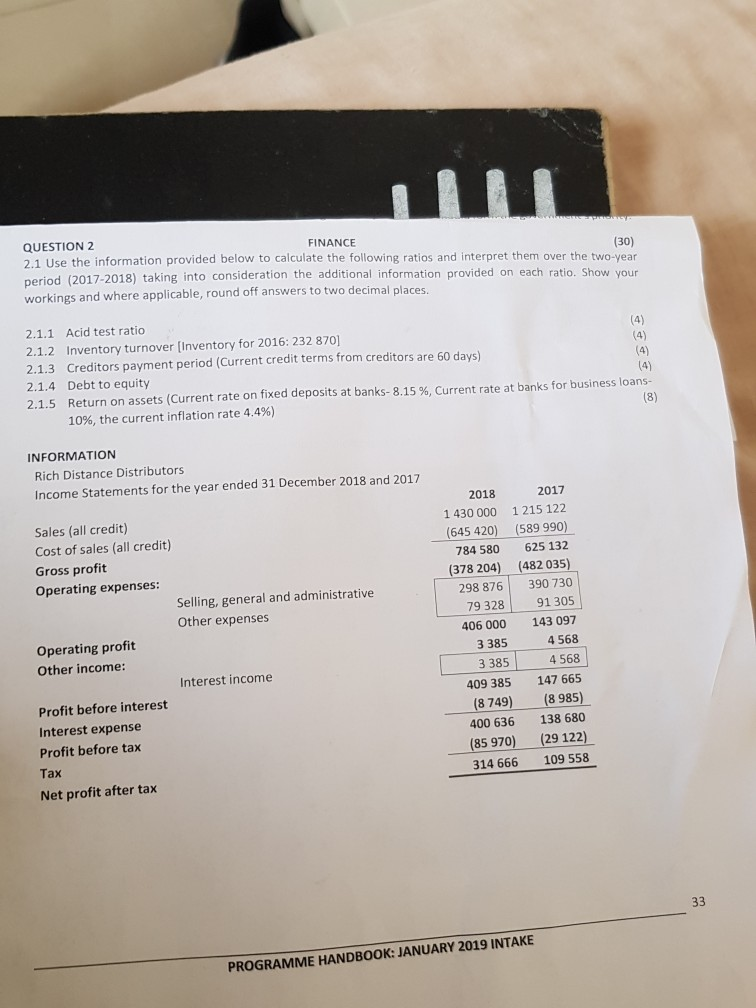
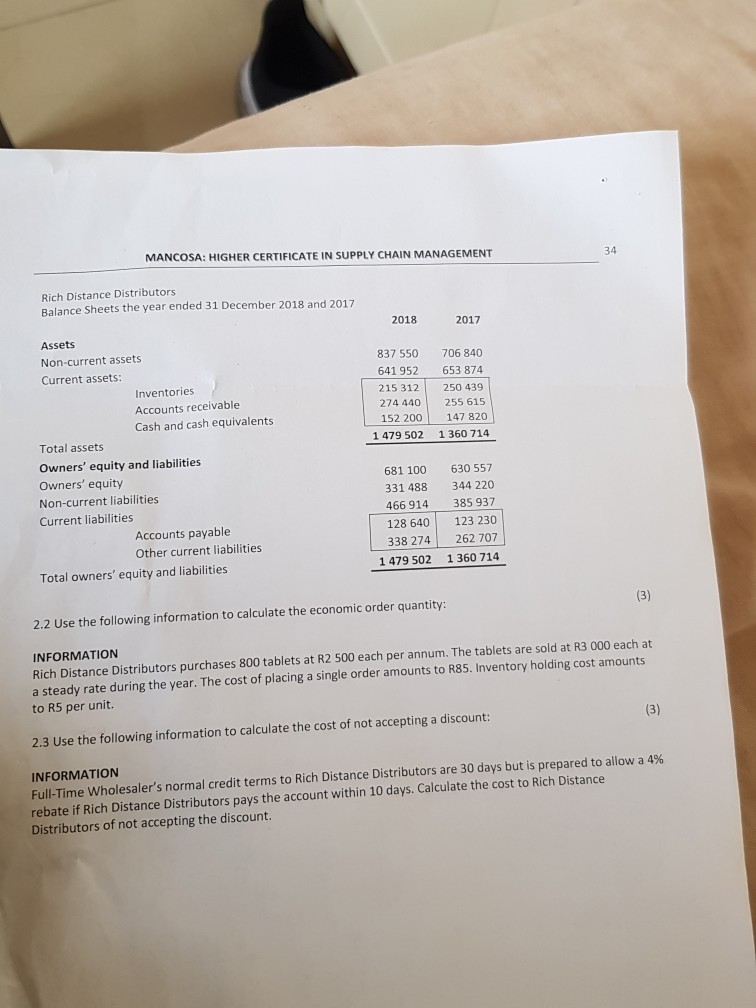
QUESTION 2 FINANCE (30) 2.1 Use the information provided below to calculate the following ratios and interpret them over the two-year period (2017-2018) taking into consideration the additional information provided on each ratio. Show your workings and where applicable, round off answers to two decimal places. 2.1.1 Acid test ratio (4) 2.1.2 Inventory turnover [Inventory for 2016: 232 870) (4) 2.1.3 Creditors payment period (Current credit terms from creditors are 60 days) (4) 2.1.4 Debt to equity 2.1.5 Return on assets (Current rate on fixed deposits at banks-8.15 %, Current rate at banks for business loans- 10%, the current inflation rate 4.4%) INFORMATION Rich Distance Distributors Income Statements for the year ended 31 December 2018 and 2017 Sales (all credit) Cost of sales (all credit) Gross profit Operating expenses: Selling, general and administrative Other expenses Operating profit Other income: Interest income Profit before interest Interest expense Profit before tax Tax Net profit after tax 2018 2017 1 430 000 1215 122 (645 420) (589 990) 784 580 625 132 (378 204) (482 035) 298 876 390 730 79 328 91 305 406 000 143 097 3 385 4 568 3 385 4568 409 385 147 665 (8 749) (8985) 400 636 138 680 (85 970) (29 122) 314 666 109 558 PROGRAMME HANDBOOK: JANUARY 2019 INTAKE MANCOSA: HIGHER CERTIFICATE IN SUPPLY CHAIN MANAGEMENT Rich Distance Distributors Balance Sheets the year ended 31 December 2018 and 2017 2018 2017 837 550 641 952 215 312 274 440 152 200 1479 502 706 840 653 874 250 439 255 615 147 820 1 360 714 Assets Non-current assets Current assets: Inventories Accounts receivable Cash and cash equivalents Total assets Owners' equity and liabilities Owners' equity Non-current liabilities Current liabilities Accounts payable Other current liabilities Total owners' equity and liabilities 681 100 331 488 466 914 128 640 338 274 1 479 502 630 557 344 220 385 937 123 230 262 707 1360 714 2.2 Use the following information to calculate the economic order quantity: INFORMATION Rich Distance Distributors purchases 800 tablets at R2 500 each per annum. The tablets are sold at R3 000 each at a steady rate during the year. The cost of placing a single order amounts to R85. Inventory holding cost amounts to R5 per unit. 2.3 Use the following information to calculate the cost of not accepting a discount: INFORMATION Full-Time Wholesaler's normal credit terms to Rich Distance Distributors are 30 days but is prepared to allow a 4% rebate if Rich Distance Distributors pays the account within 10 days. Calculate the cost to Rich Distance Distributors of not accepting the discount. QUESTION 2 FINANCE (30) 2.1 Use the information provided below to calculate the following ratios and interpret them over the two-year period (2017-2018) taking into consideration the additional information provided on each ratio. Show your workings and where applicable, round off answers to two decimal places. 2.1.1 Acid test ratio (4) 2.1.2 Inventory turnover [Inventory for 2016: 232 870) (4) 2.1.3 Creditors payment period (Current credit terms from creditors are 60 days) (4) 2.1.4 Debt to equity 2.1.5 Return on assets (Current rate on fixed deposits at banks-8.15 %, Current rate at banks for business loans- 10%, the current inflation rate 4.4%) INFORMATION Rich Distance Distributors Income Statements for the year ended 31 December 2018 and 2017 Sales (all credit) Cost of sales (all credit) Gross profit Operating expenses: Selling, general and administrative Other expenses Operating profit Other income: Interest income Profit before interest Interest expense Profit before tax Tax Net profit after tax 2018 2017 1 430 000 1215 122 (645 420) (589 990) 784 580 625 132 (378 204) (482 035) 298 876 390 730 79 328 91 305 406 000 143 097 3 385 4 568 3 385 4568 409 385 147 665 (8 749) (8985) 400 636 138 680 (85 970) (29 122) 314 666 109 558 PROGRAMME HANDBOOK: JANUARY 2019 INTAKE MANCOSA: HIGHER CERTIFICATE IN SUPPLY CHAIN MANAGEMENT Rich Distance Distributors Balance Sheets the year ended 31 December 2018 and 2017 2018 2017 837 550 641 952 215 312 274 440 152 200 1479 502 706 840 653 874 250 439 255 615 147 820 1 360 714 Assets Non-current assets Current assets: Inventories Accounts receivable Cash and cash equivalents Total assets Owners' equity and liabilities Owners' equity Non-current liabilities Current liabilities Accounts payable Other current liabilities Total owners' equity and liabilities 681 100 331 488 466 914 128 640 338 274 1 479 502 630 557 344 220 385 937 123 230 262 707 1360 714 2.2 Use the following information to calculate the economic order quantity: INFORMATION Rich Distance Distributors purchases 800 tablets at R2 500 each per annum. The tablets are sold at R3 000 each at a steady rate during the year. The cost of placing a single order amounts to R85. Inventory holding cost amounts to R5 per unit. 2.3 Use the following information to calculate the cost of not accepting a discount: INFORMATION Full-Time Wholesaler's normal credit terms to Rich Distance Distributors are 30 days but is prepared to allow a 4% rebate if Rich Distance Distributors pays the account within 10 days. Calculate the cost to Rich Distance Distributors of not accepting the discount
Step by Step Solution
There are 3 Steps involved in it
Step: 1

Get Instant Access to Expert-Tailored Solutions
See step-by-step solutions with expert insights and AI powered tools for academic success
Step: 2

Step: 3
Ace Your Homework with AI
Get the answers you need in no time with our AI-driven, step-by-step assistance
Get Started
Introductory Course On Financial Mathematics
Authors: M V Tretyakov
1st Edition
1908977388, 978-1908977380