Answered step by step
Verified Expert Solution
Question
1 Approved Answer
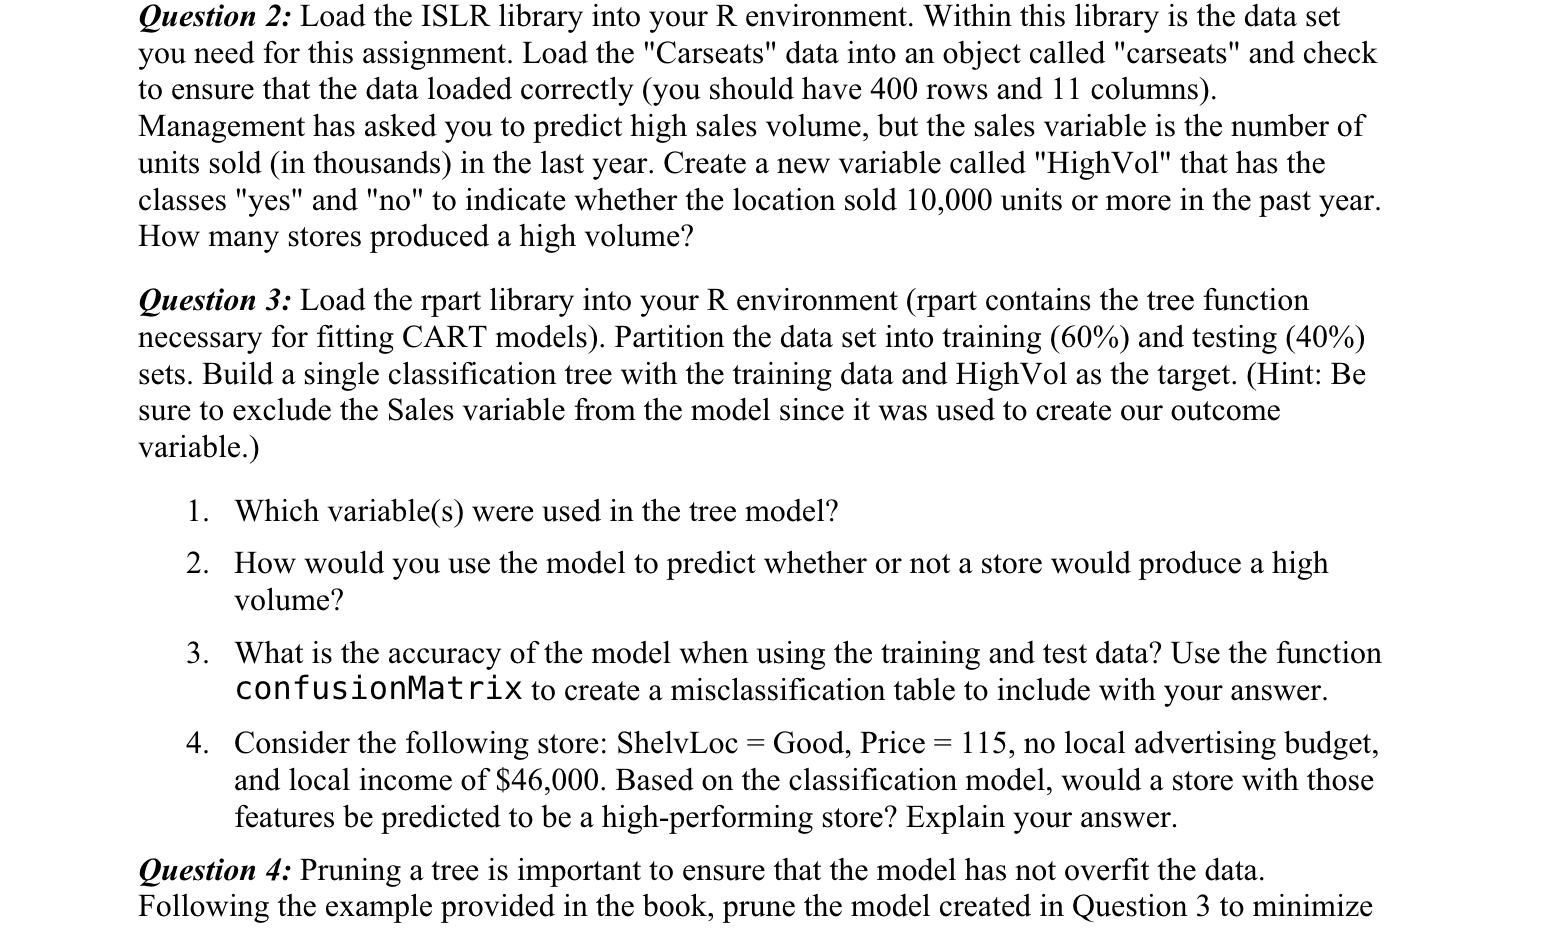
Question 2: Load the ISLR library into your R environment. Within this library is the data set you need for this assignment. Load the


Question 2: Load the ISLR library into your R environment. Within this library is the data set you need for this assignment. Load the "Carseats" data into an object called "carseats" and check to ensure that the data loaded correctly (you should have 400 rows and 11 columns). Management has asked you to predict high sales volume, but the sales variable is the number of units sold (in thousands) in the last year. Create a new variable called "High Vol" that has the classes "yes" and "no" to indicate whether the location sold 10,000 units or more in the past year. How many stores produced a high volume? Question 3: Load the rpart library into your R environment (rpart contains the tree function necessary for fitting CART models). Partition the data set into training (60%) and testing (40%) sets. Build a single classification tree with the training data and High Vol as the target. (Hint: Be sure to exclude the Sales variable from the model since it was used to create our outcome variable.) 1. Which variable(s) were used in the tree model? 2. How would you use the model to predict whether or not a store would produce a high volume? 3. What is the accuracy of the model when using the training and test data? Use the function confusionMatrix to create a misclassification table to include with your answer. 4. Consider the following store: ShelvLoc = Good, Price = 115, no local advertising budget, and local income of $46,000. Based on the classification model, would a store with those features be predicted to be a high-performing store? Explain your answer. Question 4: Pruning a tree is important to ensure that the model has not overfit the data. Following the example provided in the book, prune the model created in Question 3 to minimize the cross-validation error. How did the tree change? How many levels does the pruned tree include? What are the 3 most important variables and their relative importance according to the pruned tree model? Question 5: What is the accuracy of the pruned tree model when using the training and test data? Use the function confusionMatrix to create a misclassification table to include with your answer.
Step by Step Solution
There are 3 Steps involved in it
Step: 1

Get Instant Access to Expert-Tailored Solutions
See step-by-step solutions with expert insights and AI powered tools for academic success
Step: 2

Step: 3

Ace Your Homework with AI
Get the answers you need in no time with our AI-driven, step-by-step assistance
Get Started


