Question
Question 2 Suppose that you want Stata to create a scatterplot showing data on two variables, wage and edu. This can be done with


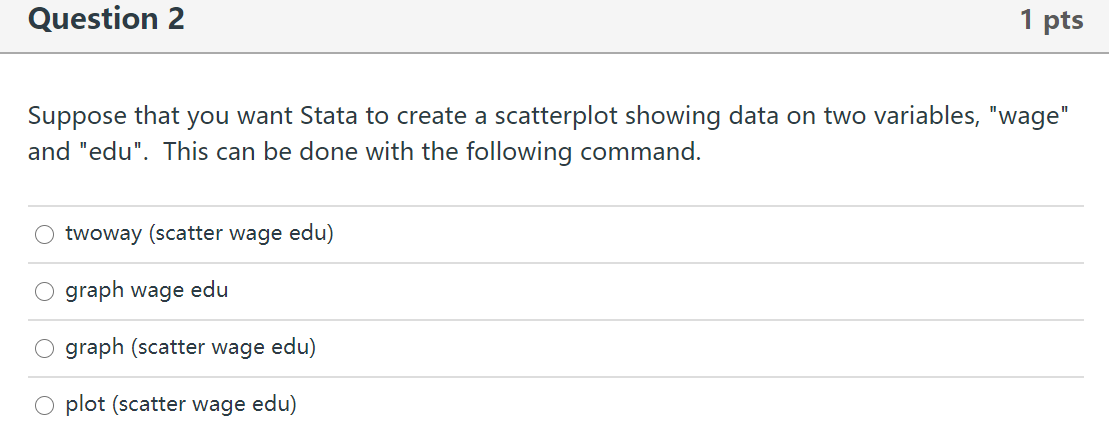
Question 2 Suppose that you want Stata to create a scatterplot showing data on two variables, "wage" and "edu". This can be done with the following command. O twoway (scatter wage edu) O graph wage edu 1 pts graph (scatter wage edu) O plot (scatter wage edu) Question 3 All else constant, a higher value for the R statistic implies that a regression line has a better fit to the data. True False 1 pts
Step by Step Solution
3.49 Rating (152 Votes )
There are 3 Steps involved in it
Step: 1
1 Option A two way scatter wage edu is correct explanation the scatter plot diagram of th...
Get Instant Access to Expert-Tailored Solutions
See step-by-step solutions with expert insights and AI powered tools for academic success
Step: 2

Step: 3

Ace Your Homework with AI
Get the answers you need in no time with our AI-driven, step-by-step assistance
Get StartedRecommended Textbook for
Elementary Statistics
Authors: Neil A. Weiss
8th Edition
321691237, 978-0321691231
Students also viewed these Economics questions
Question
Answered: 1 week ago
Question
Answered: 1 week ago
Question
Answered: 1 week ago
Question
Answered: 1 week ago
Question
Answered: 1 week ago
Question
Answered: 1 week ago
Question
Answered: 1 week ago
Question
Answered: 1 week ago
Question
Answered: 1 week ago
Question
Answered: 1 week ago
Question
Answered: 1 week ago
Question
Answered: 1 week ago
Question
Answered: 1 week ago
Question
Answered: 1 week ago
Question
Answered: 1 week ago
Question
Answered: 1 week ago
Question
Answered: 1 week ago
Question
Answered: 1 week ago
Question
Answered: 1 week ago
Question
Answered: 1 week ago
Question
Answered: 1 week ago
View Answer in SolutionInn App


