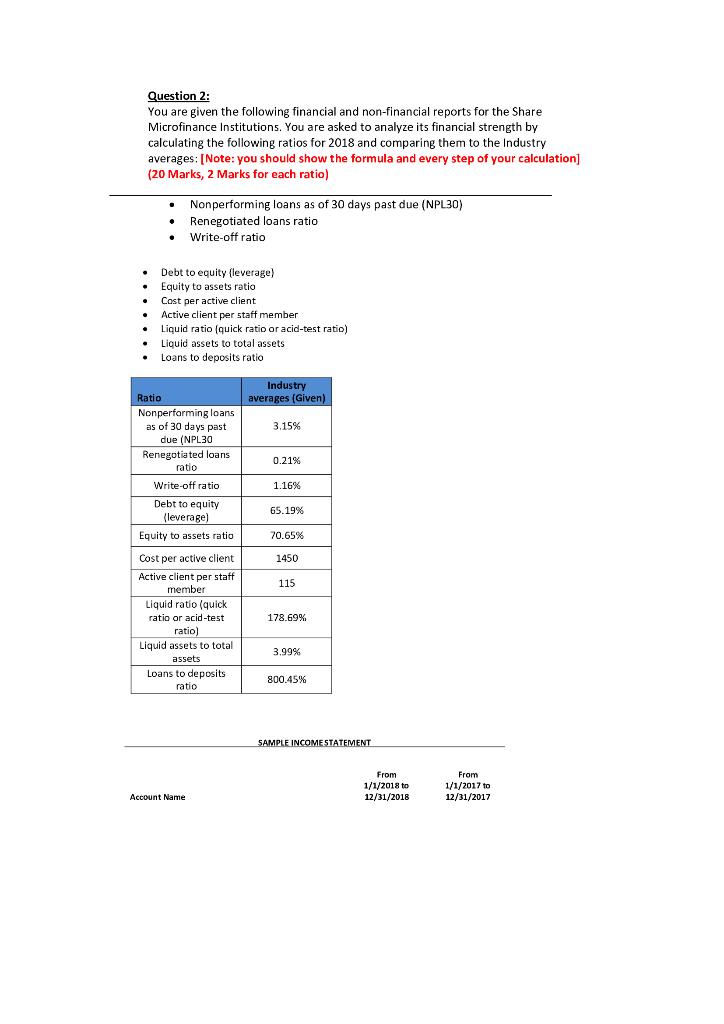
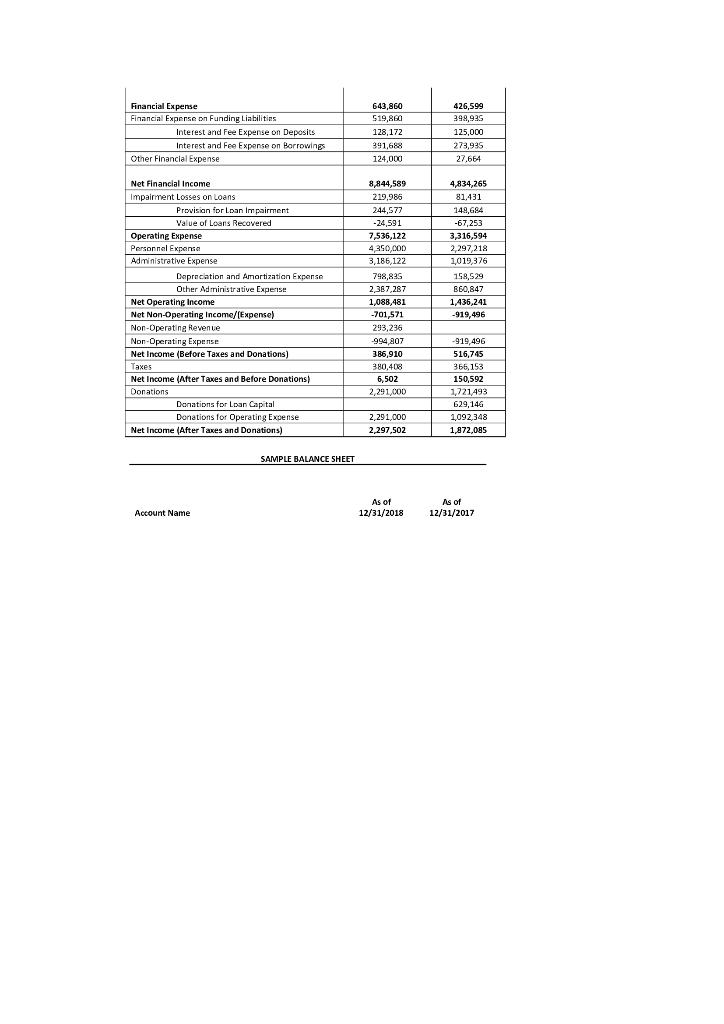
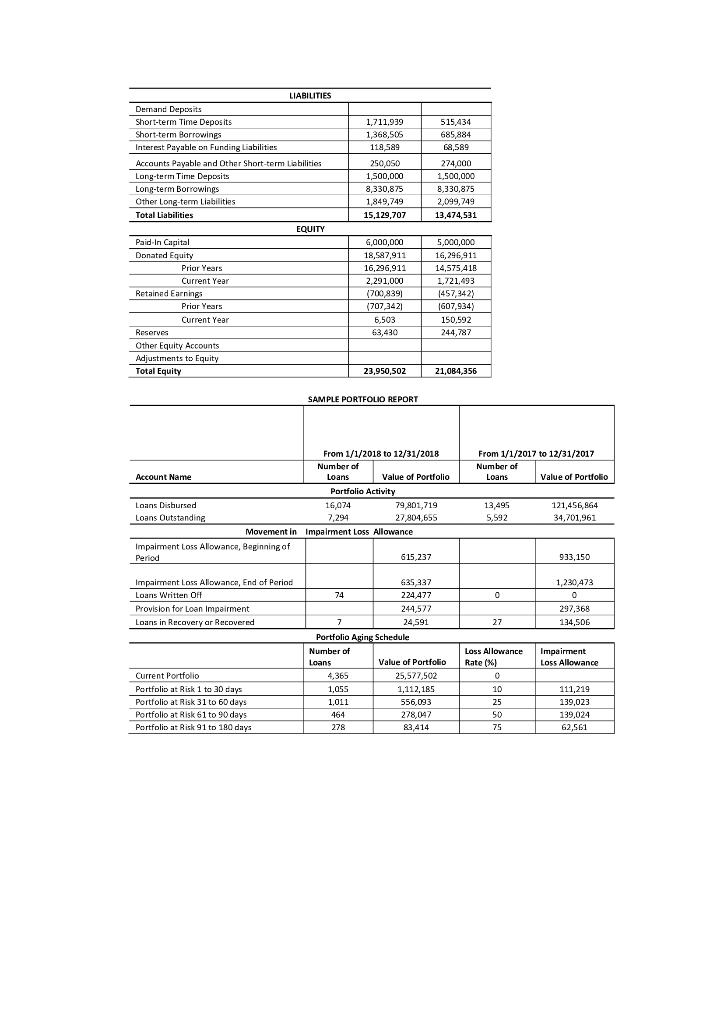
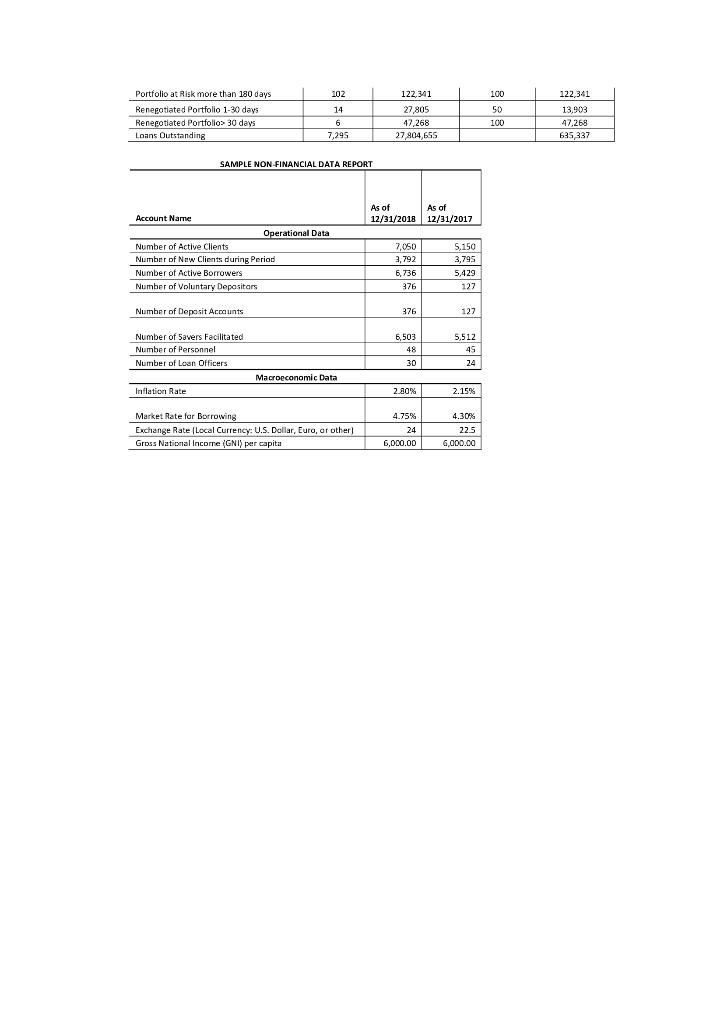
Question 2: You are given the following financial and non-financial reports for the Share Microfinance Institutions. You are asked to analyze its financial strength by calculating the following ratios for 2018 and comparing them to the Industry averages: [Note: you should show the formula and every step of your calculation] (20 Marks, 2 Marks for each ratio) Nonperforming loans as of 30 days past due (NPL30) Renegotiated loans ratio Write-off ratio . Debt to equity (leverage) Equity to assets ratio Cost per active client Active client per staff member Liquid ratio (quick ratio or acid-test ratio) Liquid assets to total assets Loans to deposits ratio Industry averages (Given) 3.15% Ratio Nonperforming loans as of 30 days past due (NPL30 Renegotiated loans ratio 0.21% Write-off ratio 1.16% Debt to equity (leverage) 65.19% Equity to assets ratio 70.65% 1450 115 Cost per active client Active client per staff member Liquid ratio (quick ratio or acid-test ratio) Liquid assets to total assets Loans to deposits ratio 178.69% 3.99% 800.45% SAMPLE INCOME STATEMENT From 1/1/2018 to 12/31/2018 From 1/1/2017 to 12/31/2017 Account Name 643,860 426,599 399,983 Financial Expense Financial Expense on Funding Liabilities Interest and Fee Expense on Deposits Interest and Fee Expense on Borrowings Other Financial Expense 519,860 128,172 125,000 391,688 273,935 124,000 27,664 4,834,265 Net Financial Income Impairment Losses on Loans Provision for Loan Impairment 8,844,589 219.985 244,577 81,431 149.GA Value of Loans Recovered -24,591 -67,253 7,536,122 3,316,594 2,297,218 4,350,000 3.186.122 1,019,376 798,825 158,529 2,387,287 B60,847 Operating Expense Personnal Expense Administrative Expense Depreciation and Amortization Experse Other Administrative Experise Net Operating Income Net Non-Operating Income/(Expense) Non-Operating Revenue Non-Operating Expense Net Income (Before Taxes and Donations) Taxes 1,436,241 1,088,481 -701,571 -919,496 293,236 994,207 -919,496 386,910 516,745 380,408 356, 153 Net Income (After Taxes and Before Donations) 6.502 150,592 Donations 2,291,000 1,721493 629,146 Donations for Loan Capital Donations for Operating Expense Net Income (After Taxes and Donations) 1,092,348 2,291,000 2.297,502 1,872,085 SAMPLE BALANCE SHEET As of 12/31/2018 As of 12/31/2017 Account Name LIABILITIES 1,711,939 1 368,50S 114 589 515,43 685,884 68,589 Dernand Deposits Short-term Time Deposits Short-term Borrowings Interest Payable on Funding Liabilities Accounts Payable and Other Short-term Liabilities Long-term Time Deposits Long-term Borrowings Other Long-term Liabilities 250,050 1,500,000 274.000 1,500,000 8,330,875 8,330,875 1,849,749 15,129,707 2,099,749 13,474,531 Total Liabilities EQUITY 4,000,000 5,000,000 Paid In Capital - Donated Equity Prior Years 18,587,911 16,296,911 16,296,911 14,575,41B Current Year Retained Earnings 2,291,000 (700,8391 ( (707 3421 1,721,493 1457,342) 1607,934) Prior Years Current Year 6,503 150.592 Reserves 63,430 244,787 Other Equity Accounts Adjustments to Equity Total Equity 23,950,5OZ 21,084,356 SAMPLE PORTFOLIO REPORT From 1/1/2018 to 12/31/2018 From 1/1/2017 to 12/31/2017 Number of Loans Number of Loans Account Name Value of Portfolio Value of Portfolio Portfolio Activity Loans Disbursed 16,074 7,294 79 201,719 27,804,655 13,495 5,592 121,456,964 34,701,961 Loans Outstanding Movement in Impairment Loss Allowance Impairment Loss Allowance, Beginning of Period 615,237 933,150 1,230473 Impairment Loss Allowance, End of Period Loans Written Of 635,237 224,477 74 0 0 Provision for Loan Impairment 244,577 297,368 Loans in Recovery ar Recovered 7 27 134,506 24,591 Portfolio Aging Schedule Number of Loss Allowance Loans Value of Portfolio Impairment Loss Allowance Rate(%) Current Portfolio 4,365 0 25,577,502 1,112,185 1,055 10 111,219 1,011 25 139,023 Portfolio at Risk 1 to 30 days Portfolio at Risk 31 to 60 days Portfolio at Risk 61 to 90 days Portfolio at Risk 91 to 180 days 464 556,093 278,04 83,414 50 139,024 278 75 62,561 Portfolio at Risk more than 180 days 102 122,341 100 122 381 14 50 13.903 Renegotiated Portfolio 1-30 days Renepotiated Portfolio 30 days Loans Outstanding 6 27,805 47,268 27 804,655 100 47.268 7,295 635 337 SAMPLE NON FINANCIAL DATA REPORT Account Name As of 12/31/2018 As of 12/31/2017 Operational Data Number of Active Clients Number of New Clients during Period 7,050 5,150 3,795 3,792 Number of Active Borrowers 6,736 5,429 Number of Voluntary Depasitars 376 127 Number of Deposit Accounts 376 127 Number of Savers Facilitated 6,503 5.512 48 45 Number of Personnel Number of Loan Officers 30 24 Macroeconomic Data Inflation Rate 2 80% 2.15% 4.75% 4.30% Market Rate for Borrowing Exchange Rate Local Currency: U.S. Dollar, Euro, or other Gross National Income (GNI) per capita 24 22.5 6,000.00 6,000.00 Question 2: You are given the following financial and non-financial reports for the Share Microfinance Institutions. You are asked to analyze its financial strength by calculating the following ratios for 2018 and comparing them to the Industry averages: [Note: you should show the formula and every step of your calculation] (20 Marks, 2 Marks for each ratio) Nonperforming loans as of 30 days past due (NPL30) Renegotiated loans ratio Write-off ratio . Debt to equity (leverage) Equity to assets ratio Cost per active client Active client per staff member Liquid ratio (quick ratio or acid-test ratio) Liquid assets to total assets Loans to deposits ratio Industry averages (Given) 3.15% Ratio Nonperforming loans as of 30 days past due (NPL30 Renegotiated loans ratio 0.21% Write-off ratio 1.16% Debt to equity (leverage) 65.19% Equity to assets ratio 70.65% 1450 115 Cost per active client Active client per staff member Liquid ratio (quick ratio or acid-test ratio) Liquid assets to total assets Loans to deposits ratio 178.69% 3.99% 800.45% SAMPLE INCOME STATEMENT From 1/1/2018 to 12/31/2018 From 1/1/2017 to 12/31/2017 Account Name 643,860 426,599 399,983 Financial Expense Financial Expense on Funding Liabilities Interest and Fee Expense on Deposits Interest and Fee Expense on Borrowings Other Financial Expense 519,860 128,172 125,000 391,688 273,935 124,000 27,664 4,834,265 Net Financial Income Impairment Losses on Loans Provision for Loan Impairment 8,844,589 219.985 244,577 81,431 149.GA Value of Loans Recovered -24,591 -67,253 7,536,122 3,316,594 2,297,218 4,350,000 3.186.122 1,019,376 798,825 158,529 2,387,287 B60,847 Operating Expense Personnal Expense Administrative Expense Depreciation and Amortization Experse Other Administrative Experise Net Operating Income Net Non-Operating Income/(Expense) Non-Operating Revenue Non-Operating Expense Net Income (Before Taxes and Donations) Taxes 1,436,241 1,088,481 -701,571 -919,496 293,236 994,207 -919,496 386,910 516,745 380,408 356, 153 Net Income (After Taxes and Before Donations) 6.502 150,592 Donations 2,291,000 1,721493 629,146 Donations for Loan Capital Donations for Operating Expense Net Income (After Taxes and Donations) 1,092,348 2,291,000 2.297,502 1,872,085 SAMPLE BALANCE SHEET As of 12/31/2018 As of 12/31/2017 Account Name LIABILITIES 1,711,939 1 368,50S 114 589 515,43 685,884 68,589 Dernand Deposits Short-term Time Deposits Short-term Borrowings Interest Payable on Funding Liabilities Accounts Payable and Other Short-term Liabilities Long-term Time Deposits Long-term Borrowings Other Long-term Liabilities 250,050 1,500,000 274.000 1,500,000 8,330,875 8,330,875 1,849,749 15,129,707 2,099,749 13,474,531 Total Liabilities EQUITY 4,000,000 5,000,000 Paid In Capital - Donated Equity Prior Years 18,587,911 16,296,911 16,296,911 14,575,41B Current Year Retained Earnings 2,291,000 (700,8391 ( (707 3421 1,721,493 1457,342) 1607,934) Prior Years Current Year 6,503 150.592 Reserves 63,430 244,787 Other Equity Accounts Adjustments to Equity Total Equity 23,950,5OZ 21,084,356 SAMPLE PORTFOLIO REPORT From 1/1/2018 to 12/31/2018 From 1/1/2017 to 12/31/2017 Number of Loans Number of Loans Account Name Value of Portfolio Value of Portfolio Portfolio Activity Loans Disbursed 16,074 7,294 79 201,719 27,804,655 13,495 5,592 121,456,964 34,701,961 Loans Outstanding Movement in Impairment Loss Allowance Impairment Loss Allowance, Beginning of Period 615,237 933,150 1,230473 Impairment Loss Allowance, End of Period Loans Written Of 635,237 224,477 74 0 0 Provision for Loan Impairment 244,577 297,368 Loans in Recovery ar Recovered 7 27 134,506 24,591 Portfolio Aging Schedule Number of Loss Allowance Loans Value of Portfolio Impairment Loss Allowance Rate(%) Current Portfolio 4,365 0 25,577,502 1,112,185 1,055 10 111,219 1,011 25 139,023 Portfolio at Risk 1 to 30 days Portfolio at Risk 31 to 60 days Portfolio at Risk 61 to 90 days Portfolio at Risk 91 to 180 days 464 556,093 278,04 83,414 50 139,024 278 75 62,561 Portfolio at Risk more than 180 days 102 122,341 100 122 381 14 50 13.903 Renegotiated Portfolio 1-30 days Renepotiated Portfolio 30 days Loans Outstanding 6 27,805 47,268 27 804,655 100 47.268 7,295 635 337 SAMPLE NON FINANCIAL DATA REPORT Account Name As of 12/31/2018 As of 12/31/2017 Operational Data Number of Active Clients Number of New Clients during Period 7,050 5,150 3,795 3,792 Number of Active Borrowers 6,736 5,429 Number of Voluntary Depasitars 376 127 Number of Deposit Accounts 376 127 Number of Savers Facilitated 6,503 5.512 48 45 Number of Personnel Number of Loan Officers 30 24 Macroeconomic Data Inflation Rate 2 80% 2.15% 4.75% 4.30% Market Rate for Borrowing Exchange Rate Local Currency: U.S. Dollar, Euro, or other Gross National Income (GNI) per capita 24 22.5 6,000.00 6,000.00


