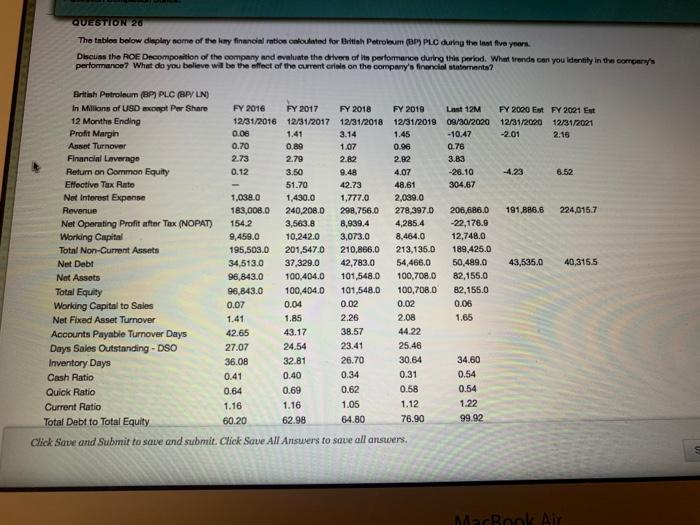
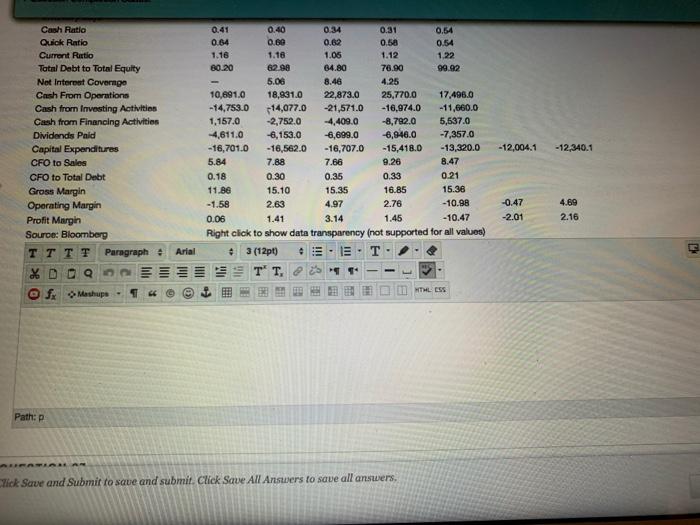
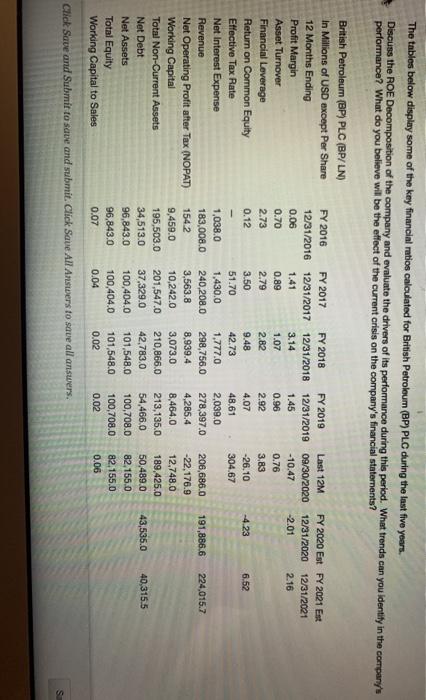
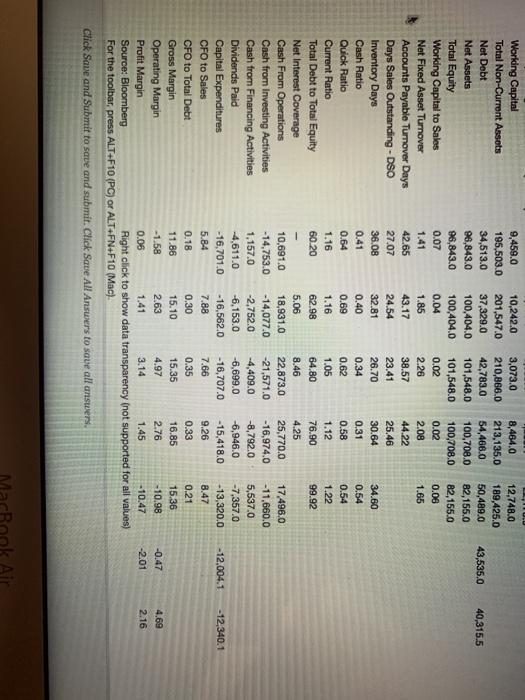
QUESTION 20 The table below display some of the key financial ratio nated for British Petroleum (BP) PLC during the last five years Discuss the ROE Decomposition of the company and evaluate the divers of ito performance during this period. Whet trends can you identity in the corrparu's performance? What do you believe will be the effect of the current or on the company's financial statements? 4.07 British Petroleum (BP) PLC (PLN) in Millions of USD except Per Share FY 2016 FY 2017 FY 2018 FY 2010 Last 12M FY 2000 EN FY 2021 Est 12 Months Ending 12/31/2016 12/31/2017 12/31/2018 12/31/2019 09/30/2020 12/31/2020 12/31/2021 Profit Margin 0.06 1.41 3.14 1.45 -10.47 -2.01 2.18 Asset Turnover 0.70 0.89 1.07 0.96 0.76 Financial Laverage 2.73 2.79 2.82 2.82 3.83 Return on Common Equity 0.12 3.50 9.48 -28.10 4.23 6.52 Effective Tax Rate 51.70 42.73 48.61 304.67 Net Interest Expense 1.038.0 1,430.0 1,777.0 2,099.0 Revenue 183,008.0 240,208.0 298,756.0 278,397.0 206,686.0 191,886.6 224,0157 Net Operating Profit after Tex (NOPAT) 1542 3,563.8 8,939.4 4,285.4 -22,176.9 Working Capital 9,458.0 10,242.0 3,073.0 8.464.0 12,748.0 Total Non-Current Assets 195,503.0 201,547.0 210,866.0 213,135.0 189,425.0 Net Debt 34,513.0 37,329.0 42,783.0 54,466.0 50,489.0 43,535.0 40,315.5 Net Assets 96,843.0 100,404.0 101,548.0 100,708.0 82,155.0 Total Equity 96,843.0 100,404.0 101,548.0 100,708.0 82,155.0 Working Capital to Sales 0.07 0.04 0.02 0.02 0.06 Net Fixed Asset Turnover 1.41 1.85 2.26 2.08 1.65 Accounts Payable Turnover Days 42.65 43.17 38.57 44.22 Days Sales Outstanding - DSO 27.07 24.54 23.41 25.46 Inventory Days 36.08 32.81 26.70 30.64 34.60 Cash Ratio 0.41 0.40 0.34 0.31 0.54 Quick Ratio 0.64 0.69 0.62 0.58 0.54 Current Ratio 1.16 1.16 1.05 1.12 1.22 Total Debt to Total Equity 60.20 62.98 64.80 76.90 99.92 Click Save and Submit to save and submit. Click Save All Answers to save all answers, MacBook Air -12.004.1 -12,340.1 Cash Ratio Quick Ratio Current Ratio Total Debt to Total Equity Net Interest Coverno Cash From Operations Cash from Investing Activities Cash from Financing Activities Dividends Paid Capital Expenditures CFO to Sales CFO to Total Debt Gross Margin Operating Margin Profit Margin Source: Bloomberg Paragraph * DOO @fx Mashup 0.41 0.40 0.34 0.31 0.54 0.64 0.60 0.62 0.58 0.54 1.16 1.16 1.05 1.12 1.22 B0.20 62 98 64.80 76.00 99.92 5.00 8.46 4.25 10,891.0 18,931.0 22,873.0 25,770.0 17,496.0 -14,753.0 14,077.0 -21,571.0 -16.974.0 -11,660.0 1,157.0 -2,752.0 -4,409.0 -8,782.0 5,537.0 4,611.0 -6,153.0 -6,699.0 6,946.0 -7,357.0 -16,701,0 -16.562.0 - 16,707.0 -15,418.0 -13,320.0 5.84 7.88 7.66 9.26 8.47 0.18 0.30 0.35 0.33 0.21 11 BE 15.10 15.35 16.85 15.38 -1.58 2.63 4.97 2.76 -10.98 0.06 1.41 3.14 1.45 -10.47 Right click to show data transparency (not supported for all values) 3 (12pt) TT. -0.47 -2.01 4.69 2.16 Arial WTHLESS Path: P Click Save and Submit to save and submit. Click Save All Answers to save all answers The tables below display some of the key financial ratios calculated for British Petroleum (BP) PLC during the last five years. Discuss the ROE Decomposition of the company and evaluate the drivers of its performance during this period. What trends can you identity in the company's performance? What do you believe will be the effect of the current crisis on the company's financial statements? FY 2020 Est FY 2021 Est 12/31/2020 12312021 -2.01 2.16 -4.23 6.52 British Petroleum (BP) PLC (BP/LN) In Millions of USD except Per Share FY 2016 FY 2017 FY 2018 FY 2019 Last 12M 12 Months Ending 12/31/2016 12/31/2017 12/31/2018 12/31/2019 09/30/2020 Profit Margin 0.06 1.41 3.14 1.45 -10.47 Asset Turnover 0.70 0.89 1.07 0.96 0.76 Financial Leverage 2.73 2.79 2.82 2.92 3,83 Return on Common Equity 0.12 3.50 9.48 4.07 -26.10 Effective Tax Rate 51.70 42.73 48.61 304.67 Net Interest Expense 1.038.0 1.430.0 1.777.0 2,039.0 Revenue 183,008.0 240,208.0 298,756.0 278,397.0 206,686.0 Net Operating Profit after Tax (NOPAT) 1542 3,563.8 8,939.4 4,285.4 -22,176.9 Working Capital 9,459.0 10,242.0 3,073.0 8,464.0 12,748.0 Total Non-Current Assets 195,503.0 201,547.0 210,866.0 213,135.0 189,425.0 Net Debt 34,513.0 37,329.0 42,783.0 54,466.0 50,489.0 Net Assets 96,843.0 100,404.0 101,548.0 100,708.0 82,155.0 Total Equity 96,843.0 100,404.0 101,548.0 100,708.0 82,155.0 Working Capital to Sales 0.07 0.04 0.02 0.02 0.06 Click Save and Submit to save and submit. Click Save All Answers to save all answers. 191,886.6 224.015.7 43,535.0 40,315,5 43,535.0 40,315.5 Working Capital 9,459.0 10,242.0 3,073.0 8,464.0 12,748.0 Total Non-Current Assets 195,503.0 201.547.0 210,866.0 213,135.0 199.425.0 Net Debt 34,513.0 37,329.0 42,783.0 54,466.0 50,489.0 Net Assets 96,843.0 100,404.0 101,548.0 100,708.0 82,155.0 Total Equity 96,843.0 100,404.0 101,548.0 100,708.0 82,155.0 Working Capital to Sales 0.07 0.04 0.02 0.02 0.08 Net Fixed Asset Turnover 1.41 1.85 2.26 2.08 1.65 Accounts Payable Turnover Days 42.65 43.17 38.57 44.22 Days Sales Outstanding - DSO 27.07 24.54 23.41 25.46 Inventory Days 36.08 32.81 26.70 30.64 34.60 Cash Ratio 0.41 0.40 0.34 0.31 0.54 Quick Ratio 0.64 0.69 0.62 0.58 0.54 Current Ratio 1.16 1.16 1.05 1.12 1.22 Total Debt to Total Equity 60.20 62.98 64.80 76.90 99.92 Net Interest Coverage 5.06 8.46 4.25 Cash From Operations 10,691.0 18,931.0 22,873.0 25,770.0 17,496.0 Cash from investing Activities - 14,753.0 -14,077.0 -21,571.0 -16,974.0 -11,660.0 Cash from Financing Activities 1,157.0 -2.752.0 -4,409.0 -8.792.0 5,537.0 Dividends Paid -4,611.0 -6,153.0 -6,699.0 -6,946.0 -7.357.0 Capital Expenditures -16.701.0 -16,562.0 -16,707.0 -15,418.0 -13,320.0 CFO to Sales 5.84 7.88 7.66 9.26 8.47 CFO to Total Debt 0.18 0.30 0.35 0.33 0.21 Gross Margin 11.86 15.10 15.35 16.85 15.36 Operating Margin -1.58 2.63 4.97 2.76 -10.98 Profit Margin 0.06 1.41 3.14 1.45 -10.47 Source: Bloomberg Right click to show data transparency (not supported for all values) For the toolbar, press ALT+F10 (PC) or ALT=FN+F10 (Mac). Click Save and Submit to save and submit. Click Save All Answers to save all unswers. -12.004.1 -12,340.1 4.69 -0.47 -2.01 2.16 QUESTION 20 The table below display some of the key financial ratio nated for British Petroleum (BP) PLC during the last five years Discuss the ROE Decomposition of the company and evaluate the divers of ito performance during this period. Whet trends can you identity in the corrparu's performance? What do you believe will be the effect of the current or on the company's financial statements? 4.07 British Petroleum (BP) PLC (PLN) in Millions of USD except Per Share FY 2016 FY 2017 FY 2018 FY 2010 Last 12M FY 2000 EN FY 2021 Est 12 Months Ending 12/31/2016 12/31/2017 12/31/2018 12/31/2019 09/30/2020 12/31/2020 12/31/2021 Profit Margin 0.06 1.41 3.14 1.45 -10.47 -2.01 2.18 Asset Turnover 0.70 0.89 1.07 0.96 0.76 Financial Laverage 2.73 2.79 2.82 2.82 3.83 Return on Common Equity 0.12 3.50 9.48 -28.10 4.23 6.52 Effective Tax Rate 51.70 42.73 48.61 304.67 Net Interest Expense 1.038.0 1,430.0 1,777.0 2,099.0 Revenue 183,008.0 240,208.0 298,756.0 278,397.0 206,686.0 191,886.6 224,0157 Net Operating Profit after Tex (NOPAT) 1542 3,563.8 8,939.4 4,285.4 -22,176.9 Working Capital 9,458.0 10,242.0 3,073.0 8.464.0 12,748.0 Total Non-Current Assets 195,503.0 201,547.0 210,866.0 213,135.0 189,425.0 Net Debt 34,513.0 37,329.0 42,783.0 54,466.0 50,489.0 43,535.0 40,315.5 Net Assets 96,843.0 100,404.0 101,548.0 100,708.0 82,155.0 Total Equity 96,843.0 100,404.0 101,548.0 100,708.0 82,155.0 Working Capital to Sales 0.07 0.04 0.02 0.02 0.06 Net Fixed Asset Turnover 1.41 1.85 2.26 2.08 1.65 Accounts Payable Turnover Days 42.65 43.17 38.57 44.22 Days Sales Outstanding - DSO 27.07 24.54 23.41 25.46 Inventory Days 36.08 32.81 26.70 30.64 34.60 Cash Ratio 0.41 0.40 0.34 0.31 0.54 Quick Ratio 0.64 0.69 0.62 0.58 0.54 Current Ratio 1.16 1.16 1.05 1.12 1.22 Total Debt to Total Equity 60.20 62.98 64.80 76.90 99.92 Click Save and Submit to save and submit. Click Save All Answers to save all answers, MacBook Air -12.004.1 -12,340.1 Cash Ratio Quick Ratio Current Ratio Total Debt to Total Equity Net Interest Coverno Cash From Operations Cash from Investing Activities Cash from Financing Activities Dividends Paid Capital Expenditures CFO to Sales CFO to Total Debt Gross Margin Operating Margin Profit Margin Source: Bloomberg Paragraph * DOO @fx Mashup 0.41 0.40 0.34 0.31 0.54 0.64 0.60 0.62 0.58 0.54 1.16 1.16 1.05 1.12 1.22 B0.20 62 98 64.80 76.00 99.92 5.00 8.46 4.25 10,891.0 18,931.0 22,873.0 25,770.0 17,496.0 -14,753.0 14,077.0 -21,571.0 -16.974.0 -11,660.0 1,157.0 -2,752.0 -4,409.0 -8,782.0 5,537.0 4,611.0 -6,153.0 -6,699.0 6,946.0 -7,357.0 -16,701,0 -16.562.0 - 16,707.0 -15,418.0 -13,320.0 5.84 7.88 7.66 9.26 8.47 0.18 0.30 0.35 0.33 0.21 11 BE 15.10 15.35 16.85 15.38 -1.58 2.63 4.97 2.76 -10.98 0.06 1.41 3.14 1.45 -10.47 Right click to show data transparency (not supported for all values) 3 (12pt) TT. -0.47 -2.01 4.69 2.16 Arial WTHLESS Path: P Click Save and Submit to save and submit. Click Save All Answers to save all answers The tables below display some of the key financial ratios calculated for British Petroleum (BP) PLC during the last five years. Discuss the ROE Decomposition of the company and evaluate the drivers of its performance during this period. What trends can you identity in the company's performance? What do you believe will be the effect of the current crisis on the company's financial statements? FY 2020 Est FY 2021 Est 12/31/2020 12312021 -2.01 2.16 -4.23 6.52 British Petroleum (BP) PLC (BP/LN) In Millions of USD except Per Share FY 2016 FY 2017 FY 2018 FY 2019 Last 12M 12 Months Ending 12/31/2016 12/31/2017 12/31/2018 12/31/2019 09/30/2020 Profit Margin 0.06 1.41 3.14 1.45 -10.47 Asset Turnover 0.70 0.89 1.07 0.96 0.76 Financial Leverage 2.73 2.79 2.82 2.92 3,83 Return on Common Equity 0.12 3.50 9.48 4.07 -26.10 Effective Tax Rate 51.70 42.73 48.61 304.67 Net Interest Expense 1.038.0 1.430.0 1.777.0 2,039.0 Revenue 183,008.0 240,208.0 298,756.0 278,397.0 206,686.0 Net Operating Profit after Tax (NOPAT) 1542 3,563.8 8,939.4 4,285.4 -22,176.9 Working Capital 9,459.0 10,242.0 3,073.0 8,464.0 12,748.0 Total Non-Current Assets 195,503.0 201,547.0 210,866.0 213,135.0 189,425.0 Net Debt 34,513.0 37,329.0 42,783.0 54,466.0 50,489.0 Net Assets 96,843.0 100,404.0 101,548.0 100,708.0 82,155.0 Total Equity 96,843.0 100,404.0 101,548.0 100,708.0 82,155.0 Working Capital to Sales 0.07 0.04 0.02 0.02 0.06 Click Save and Submit to save and submit. Click Save All Answers to save all answers. 191,886.6 224.015.7 43,535.0 40,315,5 43,535.0 40,315.5 Working Capital 9,459.0 10,242.0 3,073.0 8,464.0 12,748.0 Total Non-Current Assets 195,503.0 201.547.0 210,866.0 213,135.0 199.425.0 Net Debt 34,513.0 37,329.0 42,783.0 54,466.0 50,489.0 Net Assets 96,843.0 100,404.0 101,548.0 100,708.0 82,155.0 Total Equity 96,843.0 100,404.0 101,548.0 100,708.0 82,155.0 Working Capital to Sales 0.07 0.04 0.02 0.02 0.08 Net Fixed Asset Turnover 1.41 1.85 2.26 2.08 1.65 Accounts Payable Turnover Days 42.65 43.17 38.57 44.22 Days Sales Outstanding - DSO 27.07 24.54 23.41 25.46 Inventory Days 36.08 32.81 26.70 30.64 34.60 Cash Ratio 0.41 0.40 0.34 0.31 0.54 Quick Ratio 0.64 0.69 0.62 0.58 0.54 Current Ratio 1.16 1.16 1.05 1.12 1.22 Total Debt to Total Equity 60.20 62.98 64.80 76.90 99.92 Net Interest Coverage 5.06 8.46 4.25 Cash From Operations 10,691.0 18,931.0 22,873.0 25,770.0 17,496.0 Cash from investing Activities - 14,753.0 -14,077.0 -21,571.0 -16,974.0 -11,660.0 Cash from Financing Activities 1,157.0 -2.752.0 -4,409.0 -8.792.0 5,537.0 Dividends Paid -4,611.0 -6,153.0 -6,699.0 -6,946.0 -7.357.0 Capital Expenditures -16.701.0 -16,562.0 -16,707.0 -15,418.0 -13,320.0 CFO to Sales 5.84 7.88 7.66 9.26 8.47 CFO to Total Debt 0.18 0.30 0.35 0.33 0.21 Gross Margin 11.86 15.10 15.35 16.85 15.36 Operating Margin -1.58 2.63 4.97 2.76 -10.98 Profit Margin 0.06 1.41 3.14 1.45 -10.47 Source: Bloomberg Right click to show data transparency (not supported for all values) For the toolbar, press ALT+F10 (PC) or ALT=FN+F10 (Mac). Click Save and Submit to save and submit. Click Save All Answers to save all unswers. -12.004.1 -12,340.1 4.69 -0.47 -2.01 2.16