

Answered step by step
Verified Expert Solution
Question
1 Approved Answer
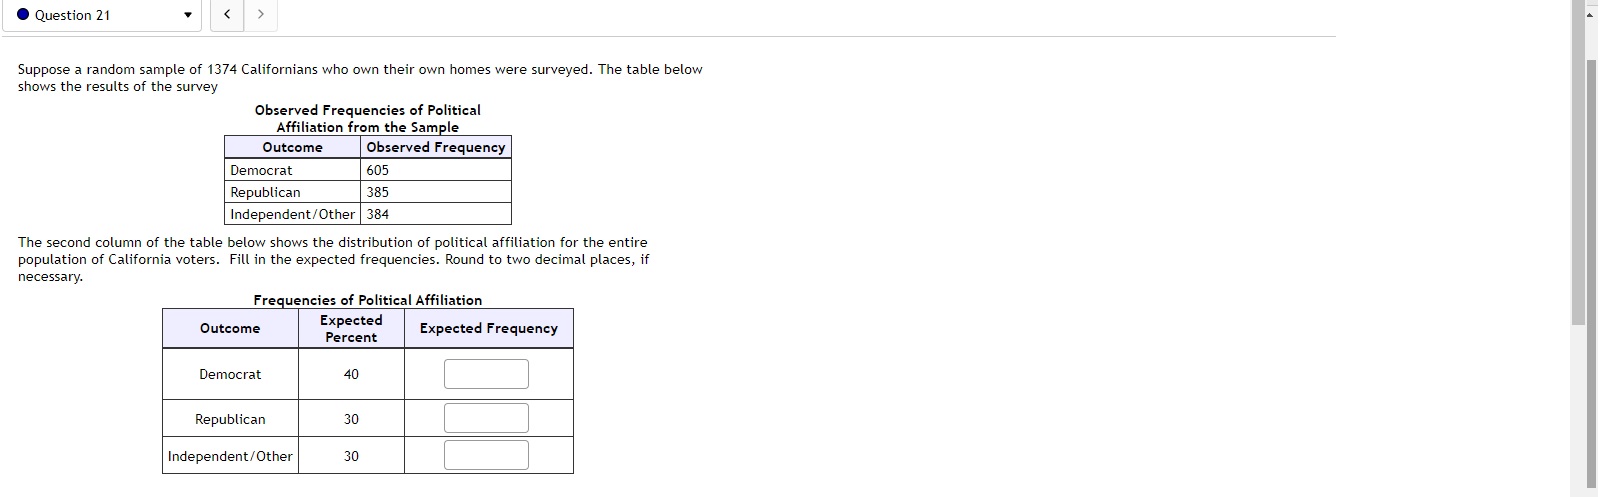
. Question 2i ' ( > Suppose a random sample M1374 Californians who own their own homes were surveyed. The table below shows the results
Step by Step Solution
There are 3 Steps involved in it
Step: 1

Get Instant Access to Expert-Tailored Solutions
See step-by-step solutions with expert insights and AI powered tools for academic success
Step: 2

Step: 3
Ace Your Homework with AI
Get the answers you need in no time with our AI-driven, step-by-step assistance
Get Started
College Algebra Concepts Through Functions
Authors: Michael Sullivan, Michael Sullivan III
3rd Edition
0321925890, 9780321925893