Answered step by step
Verified Expert Solution
Link Copied!

Question

1 Approved Answer

QUESTION 3 (15 MARKS) In the modern theory of investment, the investor may use the efficient frontier how to optimize their optimal portfolio. The Capital
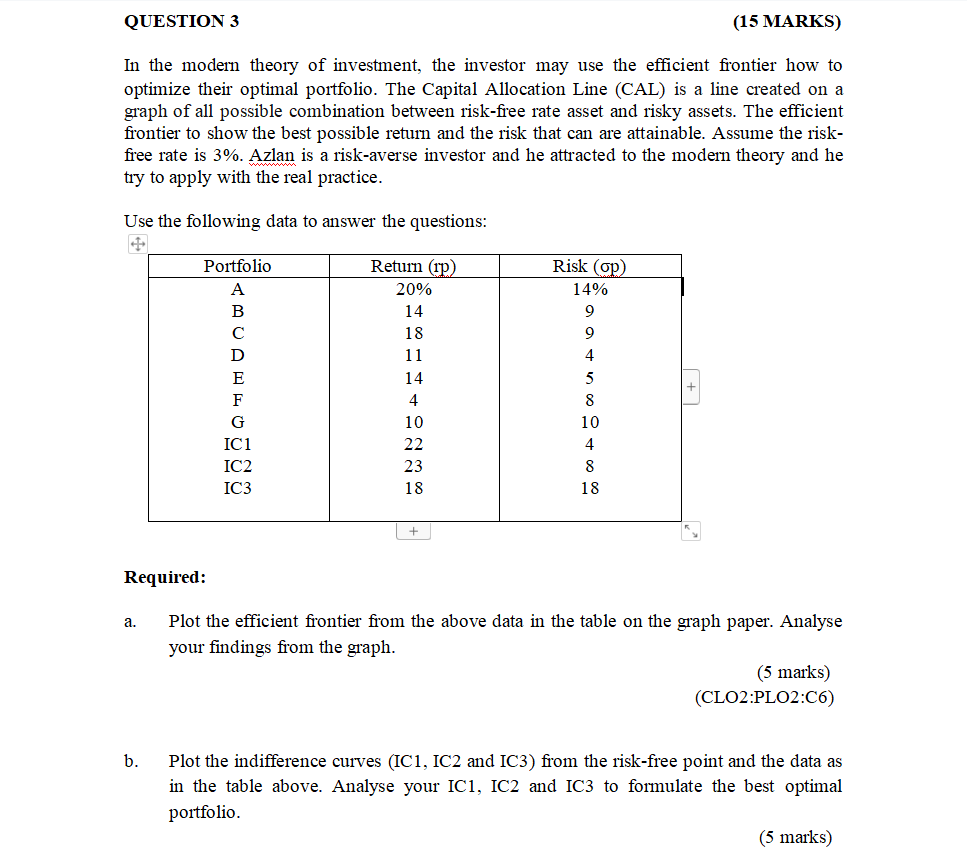
image text in transcribed

QUESTION 3 (15 MARKS) In the modern theory of investment, the investor may use the efficient frontier how to optimize their optimal portfolio. The Capital Allocation Line (CAL) is a line created on a graph of all possible combination between risk-free rate asset and risky assets. The efficient frontier to show the best possible return and the risk that can are attainable. Assume the risk- free rate is 3%. Azlan is a risk-averse investor and he attracted to the modern theory and he try to apply with the real practice. Use the following data to answer the questions: Portfolio Risk (op) 14% 9 9 250 TH DO Return (up) 20% 14 18 11 14 4 10 22 23 18 4 5 8 10 IC1 4 8 18 IC3 Required: a. Plot the efficient frontier from the above data in the table on the graph paper. Analyse your findings from the graph. (5 marks) (CLO2:PLO2:C6) b. Plot the indifference curves (IC1, IC2 and IC3) from the risk-free point and the data as in the table above. Analyse your IC1, IC2 and IC3 to formulate the best optimal portfolio (5 marks) QUESTION 3 (15 MARKS) In the modern theory of investment, the investor may use the efficient frontier how to optimize their optimal portfolio. The Capital Allocation Line (CAL) is a line created on a graph of all possible combination between risk-free rate asset and risky assets. The efficient frontier to show the best possible return and the risk that can are attainable. Assume the risk- free rate is 3%. Azlan is a risk-averse investor and he attracted to the modern theory and he try to apply with the real practice. Use the following data to answer the questions: Portfolio Risk (op) 14% 9 9 250 TH DO Return (up) 20% 14 18 11 14 4 10 22 23 18 4 5 8 10 IC1 4 8 18 IC3 Required: a. Plot the efficient frontier from the above data in the table on the graph paper. Analyse your findings from the graph. (5 marks) (CLO2:PLO2:C6) b. Plot the indifference curves (IC1, IC2 and IC3) from the risk-free point and the data as in the table above. Analyse your IC1, IC2 and IC3 to formulate the best optimal portfolio

Step by Step Solution

There are 3 Steps involved in it

Step: 1

blur-text-image

Get Instant Access to Expert-Tailored Solutions

See step-by-step solutions with expert insights and AI powered tools for academic success

Step: 2

blur-text-image

Step: 3

blur-text-image

Ace Your Homework with AI

Get the answers you need in no time with our AI-driven, step-by-step assistance

Get Started

Students also viewed these Finance questions