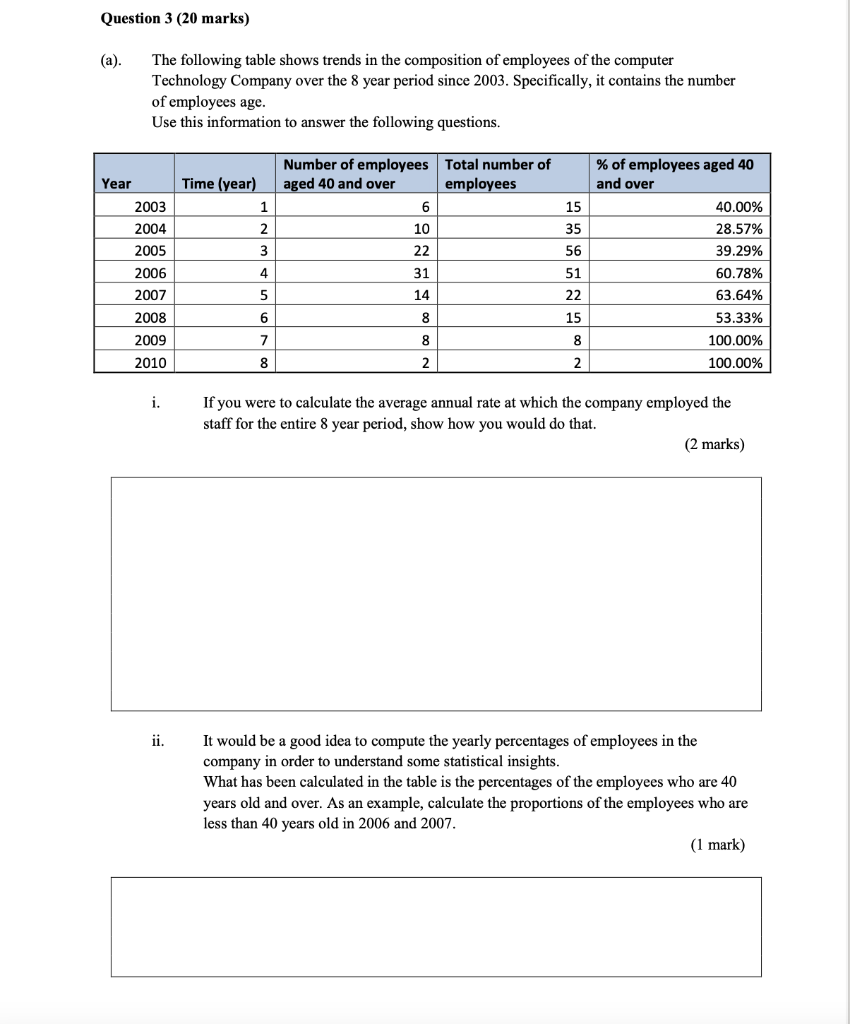
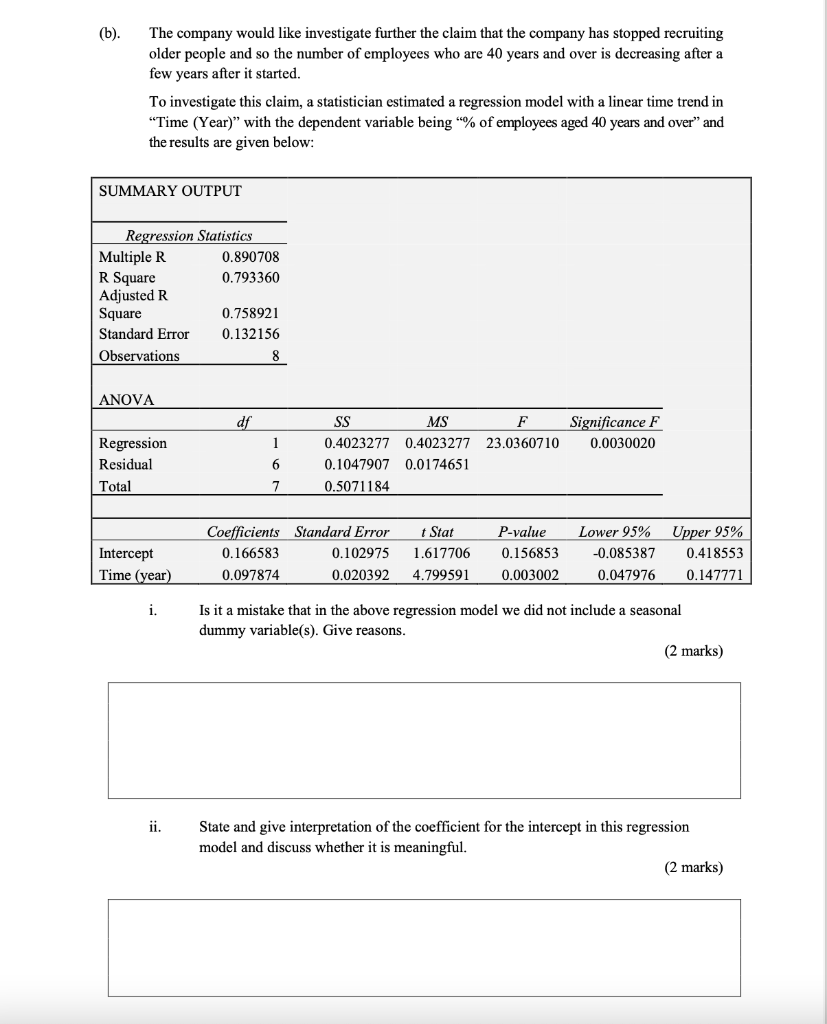
Question 3 (20 marks) (a). The following table shows trends in the composition of employees of the computer Technology Company over the 8 year period since 2003. Specifically, it contains the number of employees age. Use this information to answer the following questions. Year Time (year) 1 Number of employees Total number of aged 40 and over employees 6 15 2003 2004 2005 2 10 35 3 22 56 % of employees aged 40 and over 40.00% 28.57% 39.29% 60.78% 63.64% 53.33% 100.00% 100.00% 31 2006 2007 4 5 51 22 14 2008 6 8 15 7 8 8 2009 2010 8 2 2 i. If you were to calculate the average annual rate at which the company employed the staff for the entire 8 year period, show how you would do that. (2 marks) ii. It would be a good idea to compute the yearly percentages of employees in the company in order to understand some statistical insights. What has been calculated in the table is the percentages of the employees who are 40 years old and over. As an example, calculate the proportions of the employees who are less than 40 years old in 2006 and 2007. (1 mark) (b). The company would like investigate further the claim that the company has stopped recruiting older people and so the number of employees who are 40 years and over is decreasing after a few years after it started. To investigate this claim, a statistician estimated a regression model with a linear time trend in Time (Year)" with the dependent variable being "% of employees aged 40 years and over" and the results are given below: SUMMARY OUTPUT Regression Statistics Multiple R 0.890708 R Square 0.793360 Adjusted R Square 0.758921 Standard Error 0.132156 Observations 8 ANOVA df 1 Regression Residual Total SS MS F Significance F 0.4023277 0.4023277 23.0360710 0.0030020 0.1047907 0.0174651 0.5071184 6 7 Intercept Time (year) Coefficients Standard Error 0.166583 0.102975 0.097874 0.020392 t Stat 1.617706 4.799591 P-value 0.156853 0.003002 Lower 95% -0.085387 0.047976 Upper 95% 0.418553 0.147771 i. Is it a mistake that in the above regression model we did not include a seasonal dummy variable(s). Give reasons. (2 marks) ii. State and give interpretation of the coefficient for the intercept in this regression model and discuss whether it is meaningful. (2 marks) iii. State and interpret the coefficient for Time (Year) in this regression model. Is the sign consistent with the claim in the question? (2 marks) iv. Carry out a hypothesis test at the 5% significance level of whether there has been a change in the proportion of company employees who are aged 40 years and over during the 8 years. (4 marks) v. Would your conclusion have differed if you had chosen a 0.1% significance level? (2 marks) vi. Calculate the predicted value for the proportion of employees aged 40 years and over in 2023. Show all working (2 marks) vii. How reliable do you think your prediction in the previous question will be? Justify your answer (3 marks) Question 3 (20 marks) (a). The following table shows trends in the composition of employees of the computer Technology Company over the 8 year period since 2003. Specifically, it contains the number of employees age. Use this information to answer the following questions. Year Time (year) 1 Number of employees Total number of aged 40 and over employees 6 15 2003 2004 2005 2 10 35 3 22 56 % of employees aged 40 and over 40.00% 28.57% 39.29% 60.78% 63.64% 53.33% 100.00% 100.00% 31 2006 2007 4 5 51 22 14 2008 6 8 15 7 8 8 2009 2010 8 2 2 i. If you were to calculate the average annual rate at which the company employed the staff for the entire 8 year period, show how you would do that. (2 marks) ii. It would be a good idea to compute the yearly percentages of employees in the company in order to understand some statistical insights. What has been calculated in the table is the percentages of the employees who are 40 years old and over. As an example, calculate the proportions of the employees who are less than 40 years old in 2006 and 2007. (1 mark) (b). The company would like investigate further the claim that the company has stopped recruiting older people and so the number of employees who are 40 years and over is decreasing after a few years after it started. To investigate this claim, a statistician estimated a regression model with a linear time trend in Time (Year)" with the dependent variable being "% of employees aged 40 years and over" and the results are given below: SUMMARY OUTPUT Regression Statistics Multiple R 0.890708 R Square 0.793360 Adjusted R Square 0.758921 Standard Error 0.132156 Observations 8 ANOVA df 1 Regression Residual Total SS MS F Significance F 0.4023277 0.4023277 23.0360710 0.0030020 0.1047907 0.0174651 0.5071184 6 7 Intercept Time (year) Coefficients Standard Error 0.166583 0.102975 0.097874 0.020392 t Stat 1.617706 4.799591 P-value 0.156853 0.003002 Lower 95% -0.085387 0.047976 Upper 95% 0.418553 0.147771 i. Is it a mistake that in the above regression model we did not include a seasonal dummy variable(s). Give reasons. (2 marks) ii. State and give interpretation of the coefficient for the intercept in this regression model and discuss whether it is meaningful. (2 marks) iii. State and interpret the coefficient for Time (Year) in this regression model. Is the sign consistent with the claim in the question? (2 marks) iv. Carry out a hypothesis test at the 5% significance level of whether there has been a change in the proportion of company employees who are aged 40 years and over during the 8 years. (4 marks) v. Would your conclusion have differed if you had chosen a 0.1% significance level? (2 marks) vi. Calculate the predicted value for the proportion of employees aged 40 years and over in 2023. Show all working (2 marks) vii. How reliable do you think your prediction in the previous question will be? Justify your