

Question
Question 3 (8 marks) With reference to the mass spectra (Figure MS1) shown below:- i) Using the information in the mass spectrum identify the
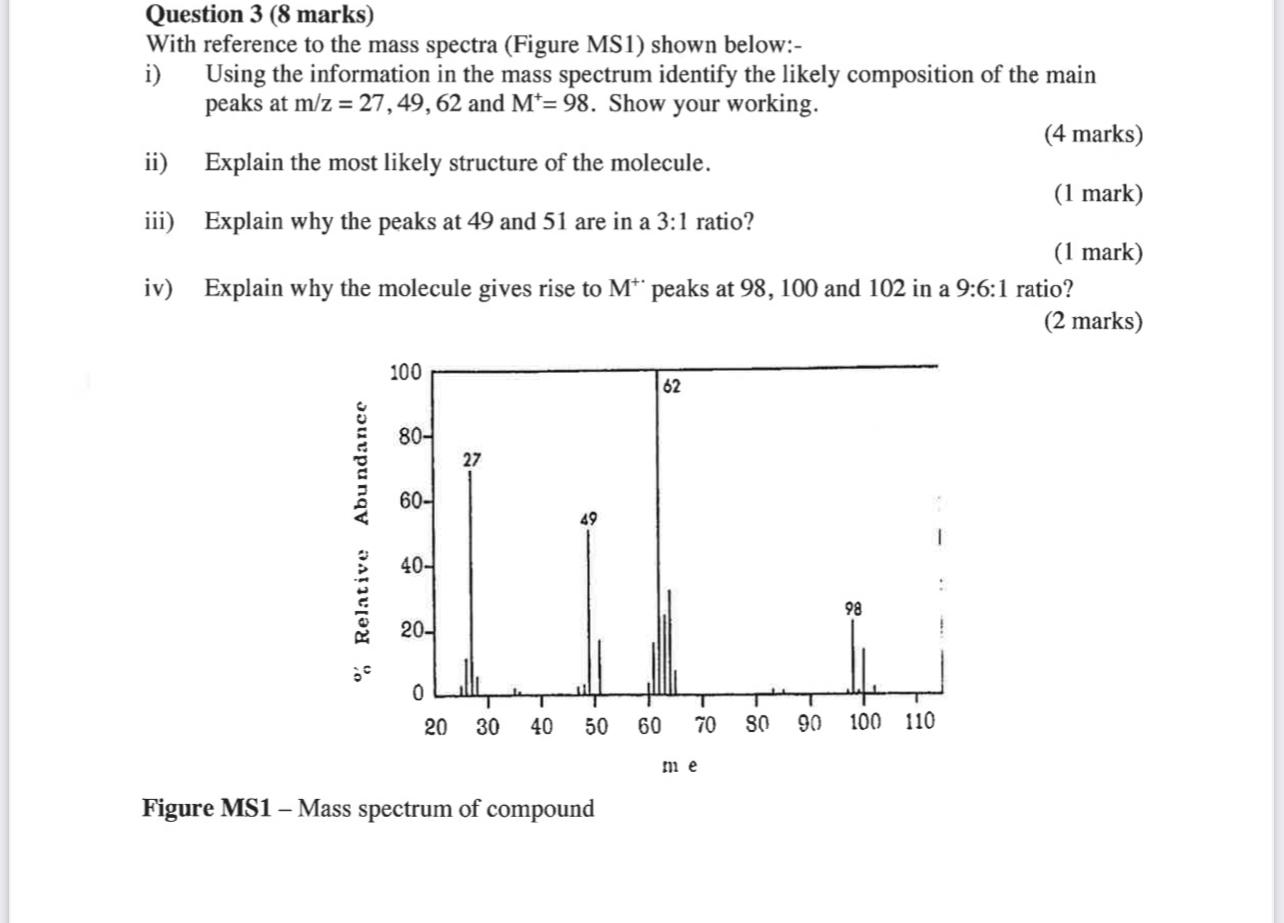
Question 3 (8 marks) With reference to the mass spectra (Figure MS1) shown below:- i) Using the information in the mass spectrum identify the likely composition of the main peaks at m/z = 27, 49, 62 and M*= 98. Show your working. ii) Explain the most likely structure of the molecule. iii) Explain why the peaks at 49 and 51 are in a 3:1 ratio? (4 marks) (1 mark) (1 mark) iv) Explain why the molecule gives rise to M** peaks at 98, 100 and 102 in a 9:6:1 ratio? (2 marks) Abundance % Relative 100 80- 27 60- 40- 20- 0 20 20 30 30 40 50 Figure MS1 - Mass spectrum of compound 49 62 98 60 60 70 80 90 100 110 me
Step by Step Solution
There are 3 Steps involved in it
Step: 1

Get Instant Access with AI-Powered Solutions
See step-by-step solutions with expert insights and AI powered tools for academic success
Step: 2

Step: 3
Ace Your Homework with AI
Get the answers you need in no time with our AI-driven, step-by-step assistance
Get Started
Cornerstones of Managerial Accounting
Authors: Mowen, Hansen, Heitger
3rd Edition
978-0324660135