Answered step by step
Verified Expert Solution
Question
1 Approved Answer
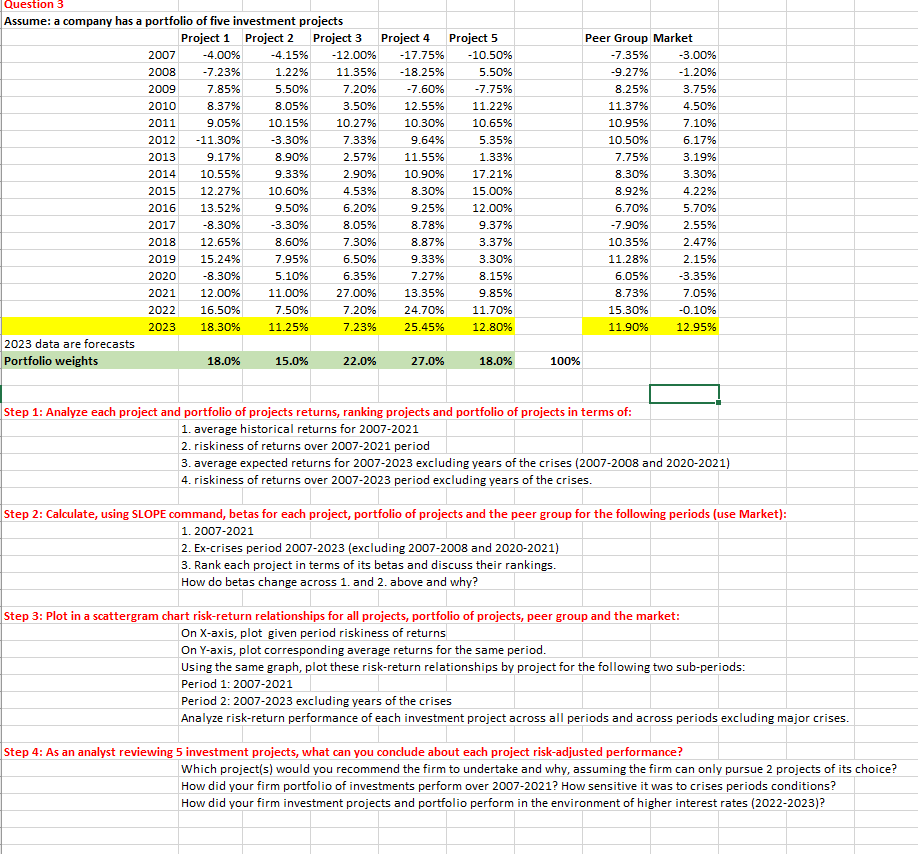
Question 3 Assume: a company has a portfolio of five investment projects Step 2: Calculate, using SLOPE command, betas for each project, portfolio of projects
 Question 3 Assume: a company has a portfolio of five investment projects Step 2: Calculate, using SLOPE command, betas for each project, portfolio of projects and the peer group for the following periods (use Market): 1. 20072021 2. Ex-crises period 2007-2023 (excluding 2007-2008 and 2020-2021) 3. Rank each project in terms of its betas and discuss their rankings. How do betas change across 1 . and 2 . above and why? Step 3: Plot in a scattergram chart risk-return relationships for all projects, portfolio of projects, peer group and the market: On X-axis, plot given period riskiness of returns On Y-axis, plot corresponding average returns for the same period. Using the same graph, plot these risk-return relationships by project for the following two sub-periods: Period 1: 2007-2021 Period 2: 2007-2023 excluding years of the crises Analyze risk-return performance of each investment project across all periods and across periods excluding major crises. Step 4: As an analyst reviewing 5 investment projects, what can you conclude about each project risk-adjusted performance? Which project(s) would you recommend the firm to undertake and why, assuming the firm can only pursue 2 projects of its choice? How did your firm portfolio of investments perform over 2007-2021? How sensitive it was to crises periods conditions? How did your firm investment projects and portfolio perform in the environment of higher interest rates (2022-2023)? Question 3 Assume: a company has a portfolio of five investment projects Step 2: Calculate, using SLOPE command, betas for each project, portfolio of projects and the peer group for the following periods (use Market): 1. 20072021 2. Ex-crises period 2007-2023 (excluding 2007-2008 and 2020-2021) 3. Rank each project in terms of its betas and discuss their rankings. How do betas change across 1 . and 2 . above and why? Step 3: Plot in a scattergram chart risk-return relationships for all projects, portfolio of projects, peer group and the market: On X-axis, plot given period riskiness of returns On Y-axis, plot corresponding average returns for the same period. Using the same graph, plot these risk-return relationships by project for the following two sub-periods: Period 1: 2007-2021 Period 2: 2007-2023 excluding years of the crises Analyze risk-return performance of each investment project across all periods and across periods excluding major crises. Step 4: As an analyst reviewing 5 investment projects, what can you conclude about each project risk-adjusted performance? Which project(s) would you recommend the firm to undertake and why, assuming the firm can only pursue 2 projects of its choice? How did your firm portfolio of investments perform over 2007-2021? How sensitive it was to crises periods conditions? How did your firm investment projects and portfolio perform in the environment of higher interest rates (2022-2023)
 Step by Step Solution
There are 3 Steps involved in it
Step: 1

Get Instant Access to Expert-Tailored Solutions
See step-by-step solutions with expert insights and AI powered tools for academic success
Step: 2

Step: 3

Ace Your Homework with AI
Get the answers you need in no time with our AI-driven, step-by-step assistance
Get Started


