Question 3 (Chapter 3) A labor market has, like any other market, has both a demand side and a supply side. More specifically, the employer
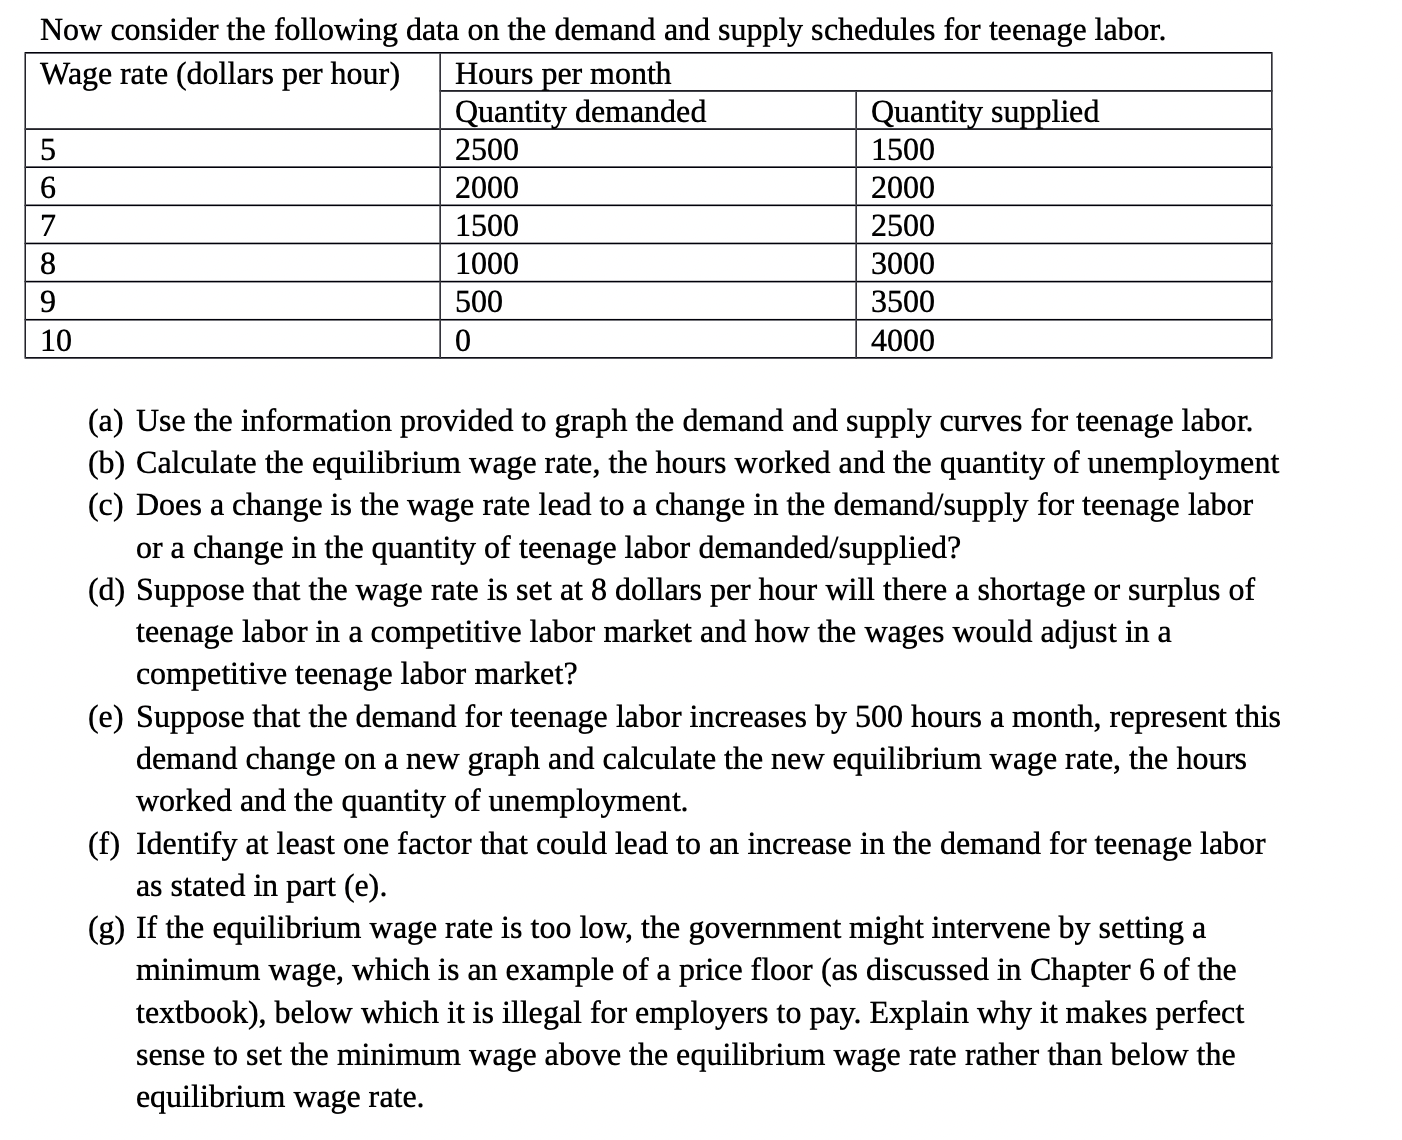
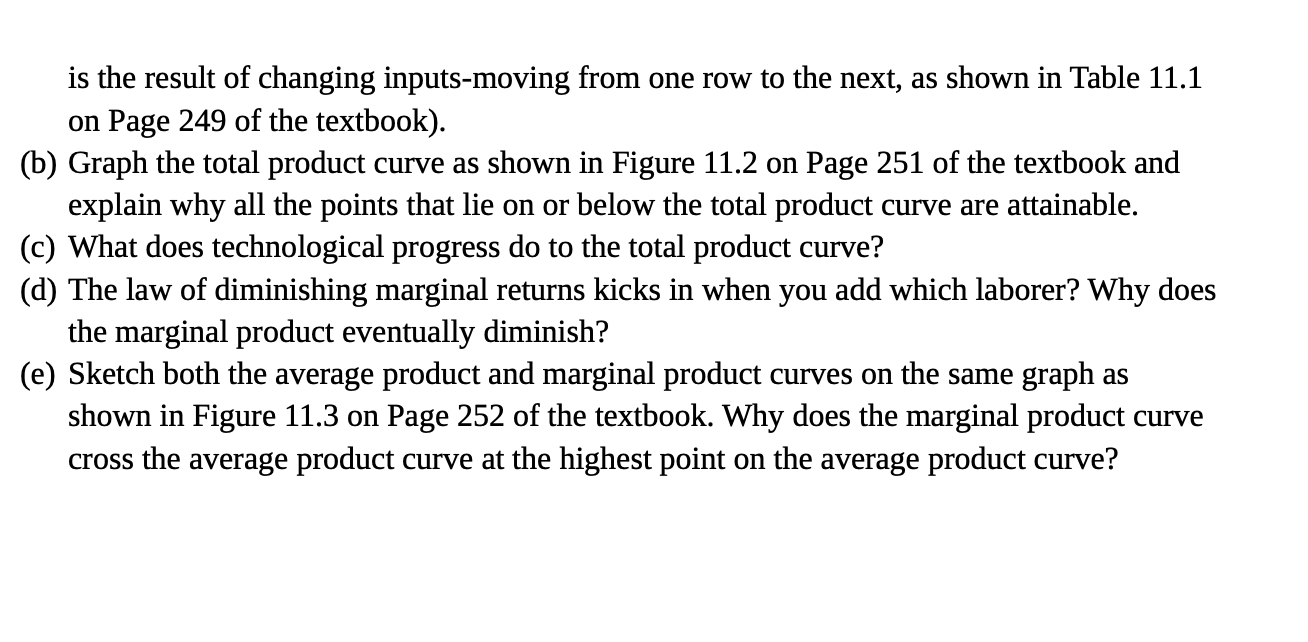
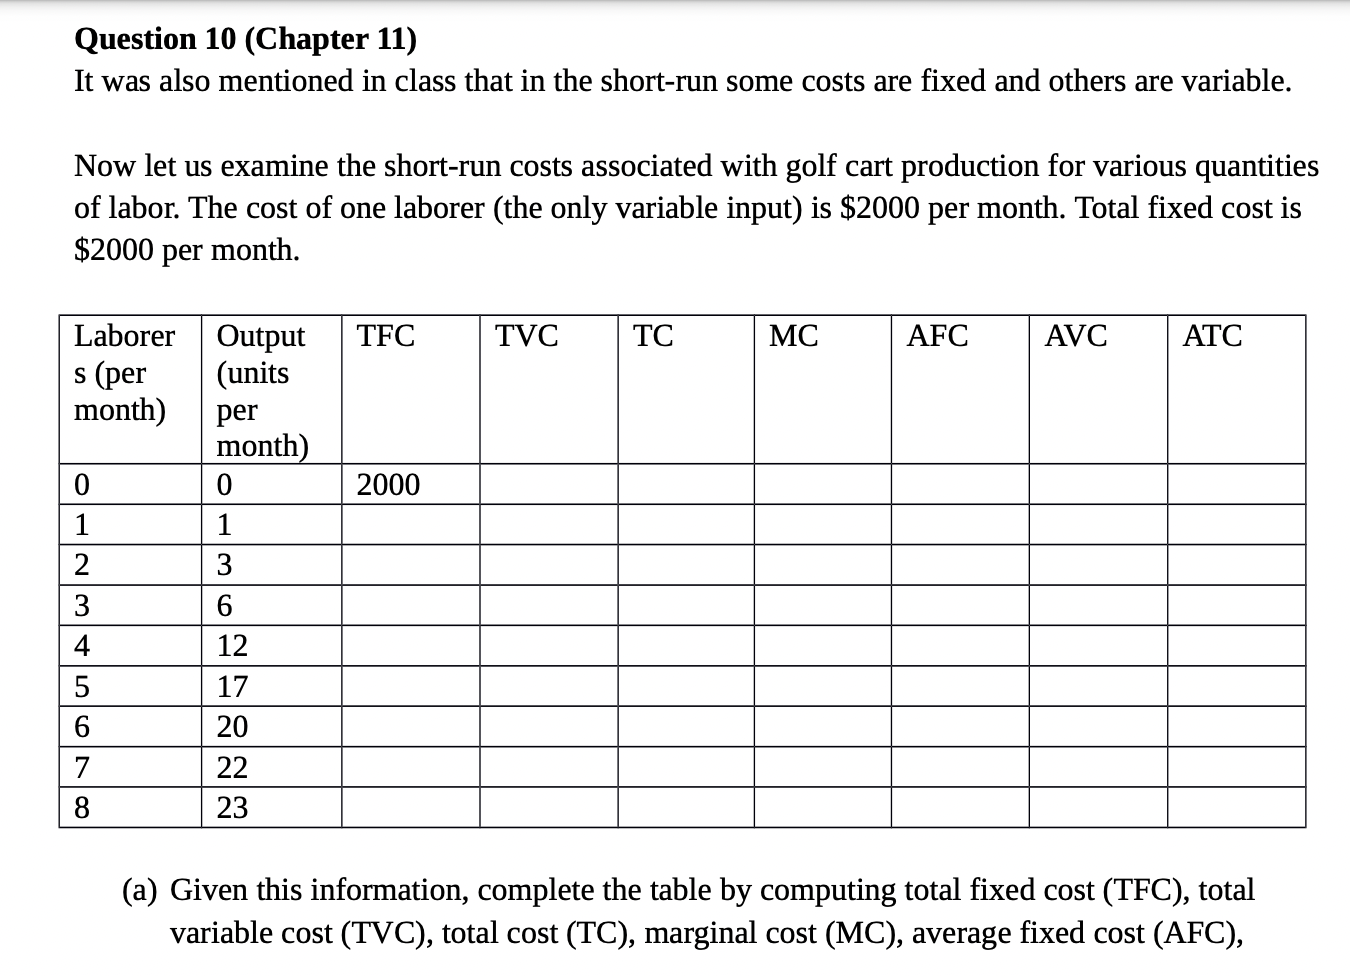
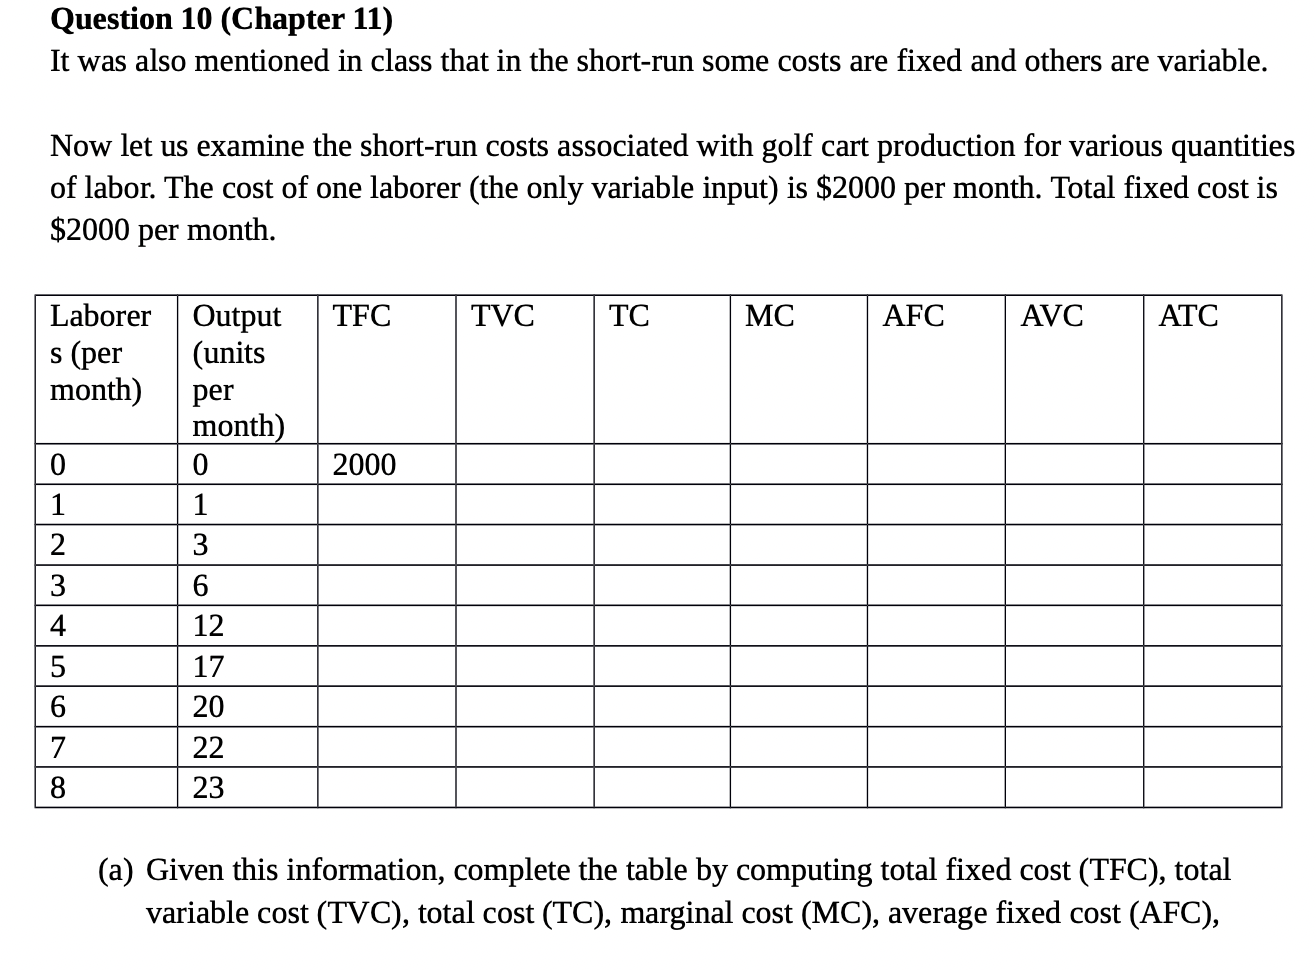
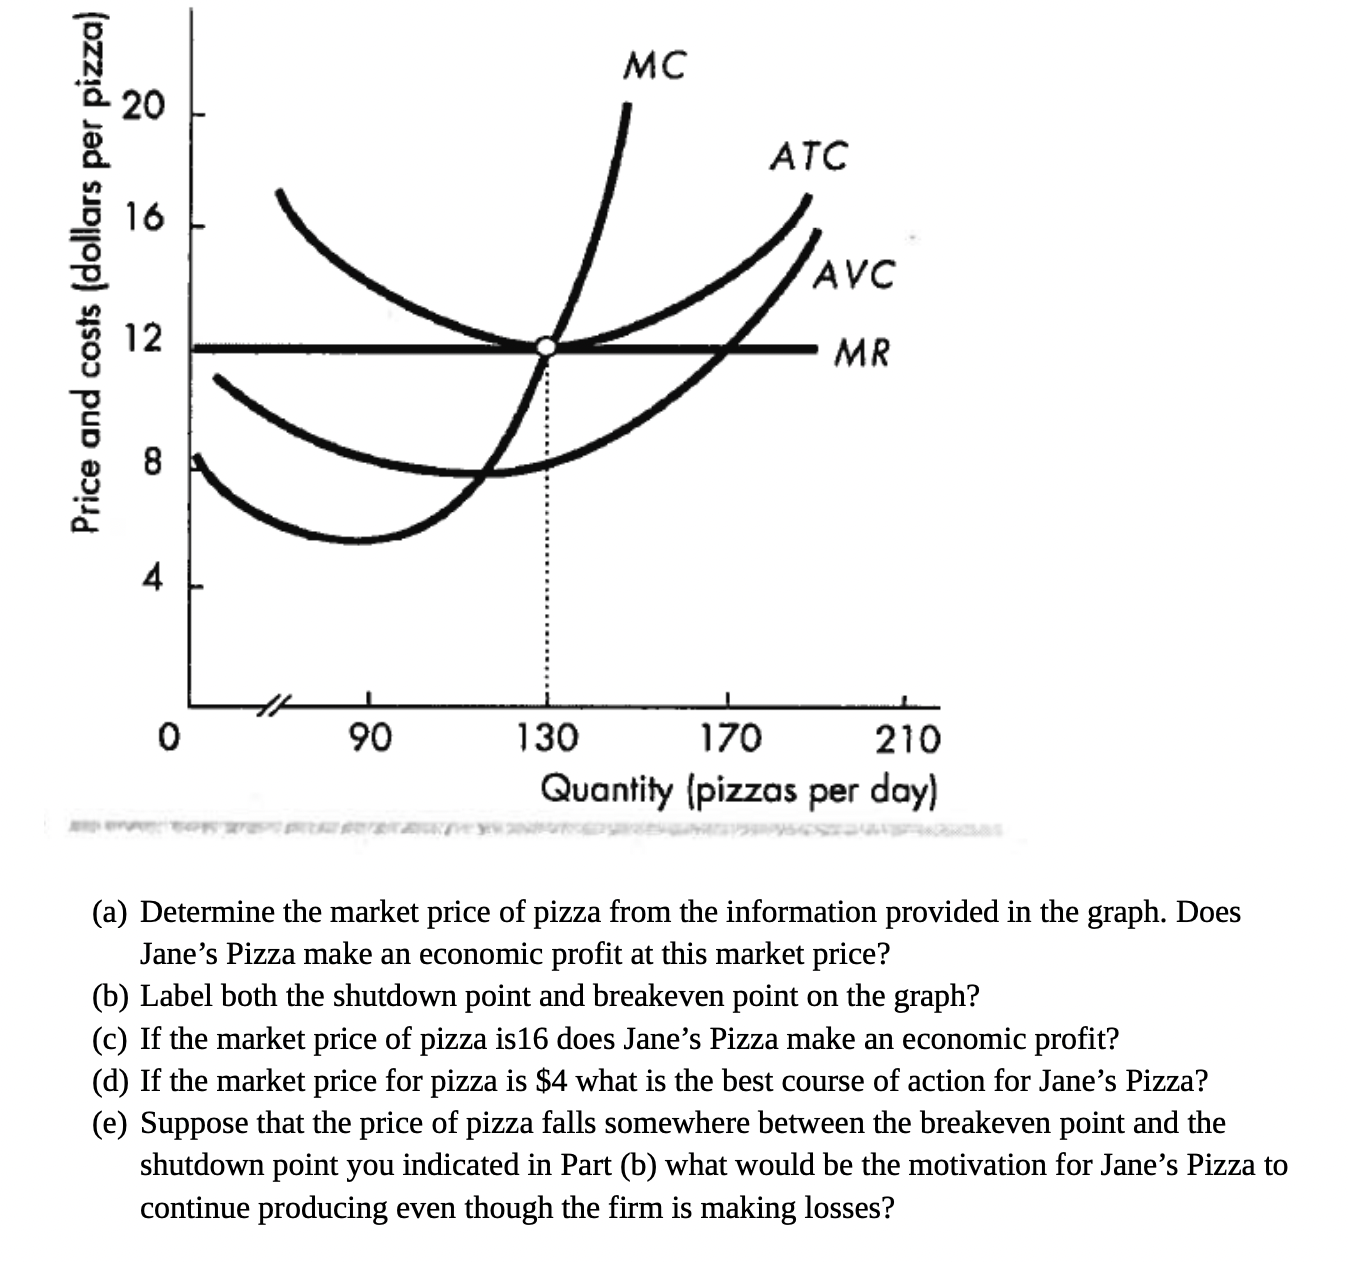
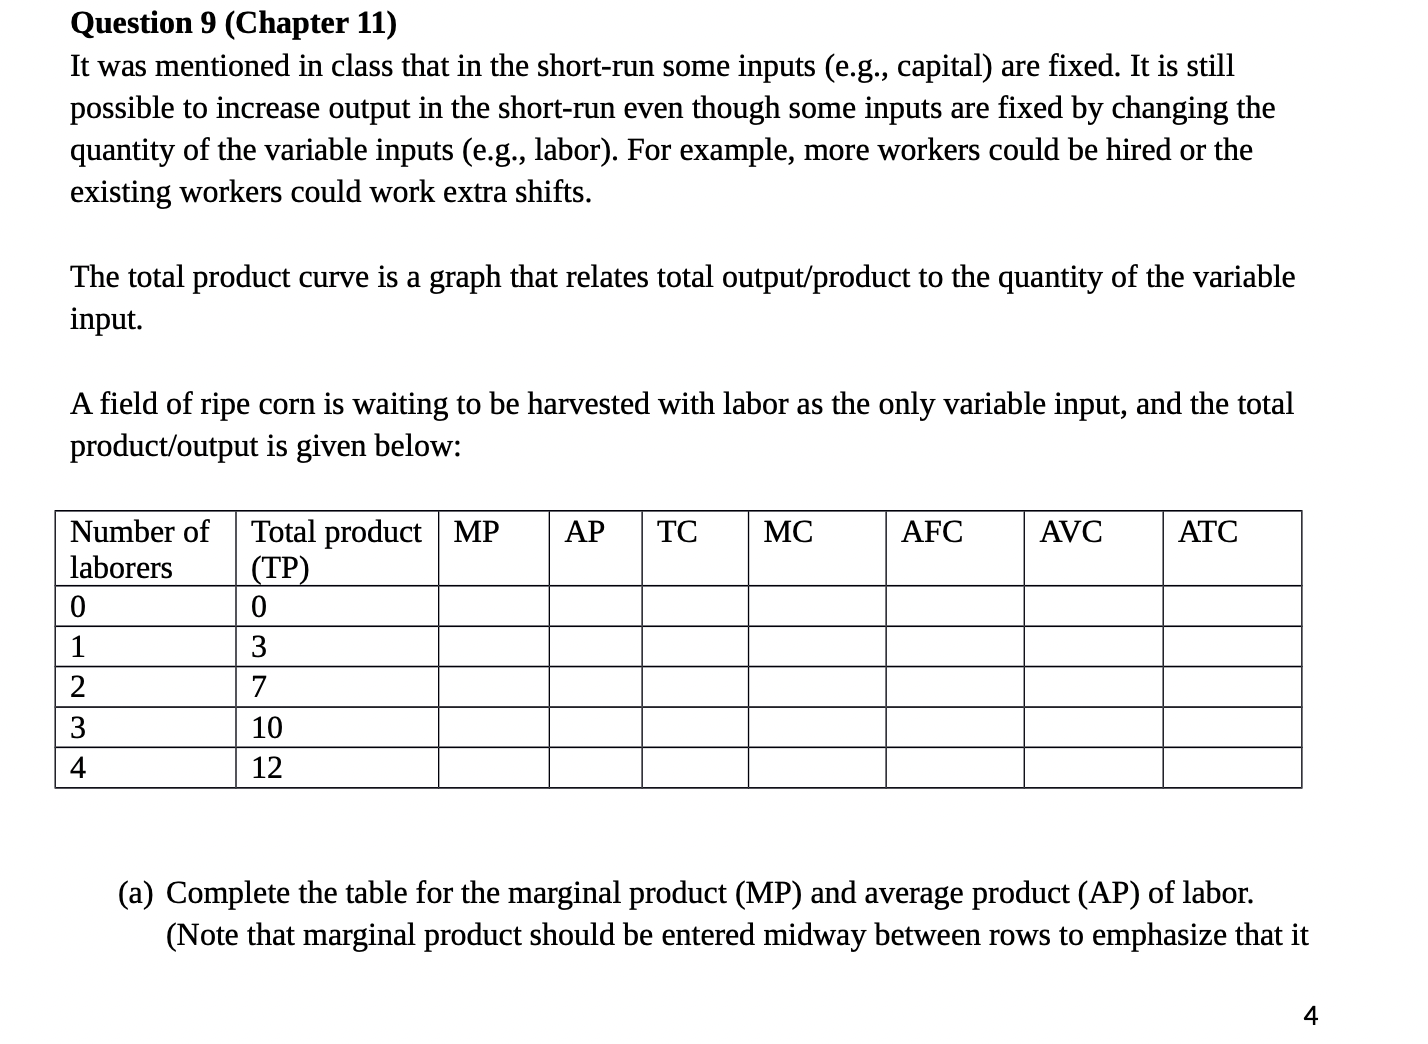
Question 3 (Chapter 3) A labor market has, like any other market, has both a demand side and a supply side. More specifically, the employer is the buyer of labor; the job seeker is the seller of labor and the wage rate is the price of labor. Hence employers feature on the demand side of the labor market and the job seekers feature on the supply side. In conformity with the conventional practice of putting price on the vertical scale of the demand/supply curve we must put the wage rate on the vertical scale of the demand/supply curve for labor. The demand for labor, like the demand for other factors of production, is a derived demand meaning that the demand for labor is derived from the demand for goods and services that the labor is used to produce. Now consider the following data on the demand and supply schedules for teenage labor. Wage rate (dollars per hour) Quantit 311- died 1500 2000 1500 2500 1000 3000 500 3500 _ 4000 (a) Use the information provided to graph the demand and supply curves for teenage labor. (b) Calculate the equilibrium wage rate, the hours worked and the quantity of unemployment (c) Does a change is the wage rate lead to a change in the demand/supply for teenage labor or a change in the quantity of teenage labor demanded/supplied? (d) Suppose that the wage rate is set at 8 dollars per hour will there a shortage or surplus of teenage labor in a competitive labor market and how the wages would adjust in a competitive teenage labor market? (e) Suppose that the demand for teenage labor increases by 500 hours a month, represent this demand change on a new graph and calculate the new equilibrium wage rate, the hours worked and the quantity of unemployment. (f) Identify at least one factor that could lead to an increase in the demand for teenage labor as stated in part (e). (g) If the equilibrium wage rate is too low, the government might intervene by setting a minimum wage, which is an example of a price floor (as discussed in Chapter 6 of the textbook), below which it is illegal for employers to pay. Explain why it makes perfect sense to set the minimum wage above the equilibrium wage rate rather than below the equilibrium wage rate. Question 6 (Chapter 10) Executive compensation, based on performance, can theoretically constrain pay, but companies are paying their top executives more and more. According to a CNBC article that appeared on April 28, 2014 the median compensation of a CEO in 2013 was $13.9 million, up 9 percent from 2012. (a) What is the economic problem that performance-based executive compensation designed to solve? (b) Would paying executives with stock ensure that the interests of the executives are in line with those of the shareholders? Briefly explain. n .' n- It\"! . dnx Question 9 (Chapter 11) It was mentioned in class that in the short-run some inputs (e. g., capital) are fixed. It is still possible to increase output in the short-run even though some inputs are fixed by changing the quantity of the variable inputs (e.g., labor). For example, more workers could be hired or the existing workers could work extra shifts. The total product curve is a graph that relates total output/product to the quantity of the variable input. A field of ripe corn is waiting to be harvested with labor as the only variable input, and the total product/output is given below: Number of Total product MP AP TC MC AFC AVC ATC laborers TP 3 7 _---____ _---____ (a) Complete the table for the marginal product (MP) and average product (AP) of labor. (Note that marginal product should be entered midway between rows to emphasize that it 4 is the result of changing inputs-moving from one row to the next, as shown in Table 11.1 on Page 249 of the textbook). (b) Graph the total product curve as shown in Figure 11.2 on Page 251 of the textbook and explain why all the points that lie on or below the total product curve are attainable. (c) What does technological progress do to the total product curve? ((1) The law of diminishing marginal returns kicks in when you add which laborer? Why does the marginal product eventually diminish? (e) Sketch both the average product and marginal product curves on the same graph as shown in Figure 11.3 on Page 252 of the textbook. Why does the marginal product curve cross the average product curve at the highest point on the average product curve? Question 10 (Chapter 11) It was also mentioned in class that in the shortrun some costs are fixed and others are variable. Now let us examine the short-run costs associated with golf cart production for various quantities of labor. The cost of one laborer (the only variable input) is $2000 per month. Total fixed cost is $2000 per month. 1 2 com-ho.) 03's] 23 (a) Given this information, complete the table by computing total fixed cost (TFC), total variable cost (TVC), total cost (TC), marginal cost (MC), average fixed cost (AFC), Question 10 (Chapter 11) It was also mentioned in class that in the shortrun some costs are fixed and others are variable. Now let us examine the short-run costs associated with golf cart production for various quantities of labor. The cost of one laborer (the only variable input) is $2000 per month. Total fixed cost is $2000 per month. 1 2 #0.) Kim MMHH MOMM U1 CD 23 (a) Given this information, complete the table by computing total fixed cost (TFC), total variable cost (TVC), total cost (TC), marginal cost (MC), average fixed cost (AFC), average variable cost (AVG) and average total cost (ATC). Your completed table should look like the table on page 255 of the textbook. (b) Label the axes and draw the TC, TVC and TFC on the same graph. (C) Label the axes and draw the MC, ATC, and AVG, and AFC curves on a single graph. Be sure to plot MC midway between the corresponding units of output. (d) Why must the marginal cost curve cross the average total cost curve at the minimum point of the average total cost curve? Question 11 (Chapter 12) If you recall from the discussion in Chapter 11, a perfectly competitive (or price-taker) market is one for which there are many buyers and sellers in which case the action of a single buyer or seller cannot inuence the market price. Furthermore, the sellers sell identical or differentiated products. Owing to stiff competition we would expect the values of the competition measures (e. g., four-firm concentration ratio and the Herfindahl-Hirschman index) to be (very close) to 0 for perfect competition. Also, as discussed in class, the inability of a firm operating in a perfectly competitive market also means that both the demand curve and the marginal revenue curve are both horizontal (recall that a horizontal demand curve is deemed to be perfectly elastic). Jane's Pizza is a perfectly competitive firm. The cost curves and marginal revenue (MR) curves Jane's Pizza faces are shown below. T? B 320 8 ATC gib 31 {AVC .I'.' 12 MR '5 5 .3 B it 4 0 90 130 170 210 Quantity [pizzas per day) (a) Determine the market price of pizza from the information provided in the graph. Does Jane's Pizza make an economic profit at this market price? (b) Label both the shutdown point and breakeven point on the graph? (c) If the market price of pizza is 16 does Jane's Pizza make an economic profit? (d) If the market price for pizza is $4 what is the best course of action for Jane's Pizza? (e) Suppose that the price of pizza falls somewhere between the breakeven point and the shutdown point you indicated in Part (b) what would be the motivation for Jane's Pizza to continue producing even though the firm is making losses? Question 12 (Chapter 13) Ron's Hamburger Joint is the only restaurant in town. The figure below represents Ron's cost, demand, and marginal revenue curves. Ron operates as a single-price monopoly. If you recall from the discussion in Chapter 12, a monopoly (or price-maker) market is one for which there is only one seller which means that the action of the sole seller greatly inuences the market price. Owing to complete lack of competition the four-firm concentration ratio and HerfindahlHirschman index to be 100 and 10,000, respectively, which are the maximum values for the relevant measures of competition. Also, as discussed in class, the ability of a firm operating in a monopoly market to influence the market price also means that the marginal revenue curve lies on or below the demand curve. 10.00 9.00 l 8.00 7.00 6.00 5.00 4.00 3.00 2.00 1.00 Price and cost {dollars per hamburger) 0 10 20 30 40 50 Quantity [hamburgers per hour) (a) How many hamburgers does Ron produce? (b) What price does Ron charge for a hamburger? (c) What is Ron's economic profit? (d) Ron's friend, an economist, asks him to consider switching from a single-price monopoly to a price-discriminating monopolist. What would Ron gain this switch? (e) What are the conditions for successful price discrimination
Step by Step Solution
There are 3 Steps involved in it
Step: 1
Get Instant Access to Expert-Tailored Solutions
See step-by-step solutions with expert insights and AI powered tools for academic success
Step: 2
Step: 3
Ace Your Homework with AI
Get the answers you need in no time with our AI-driven, step-by-step assistance