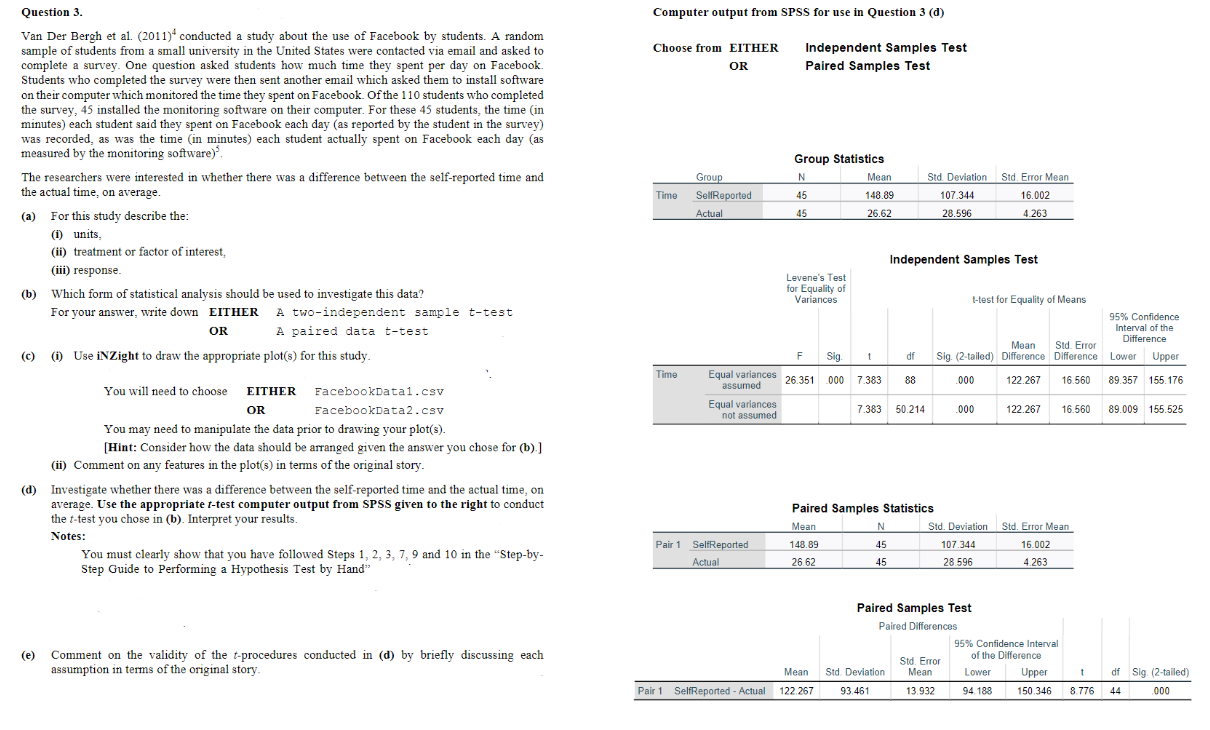
Question 3. Computer output from SPSS for use in Question 3 (d) Van Der Bergh et al. (2011) conducted a study about the use of
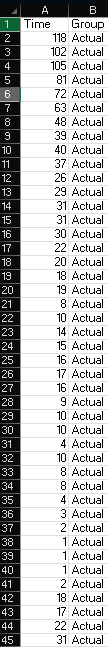
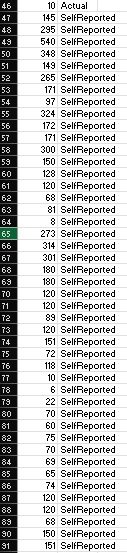
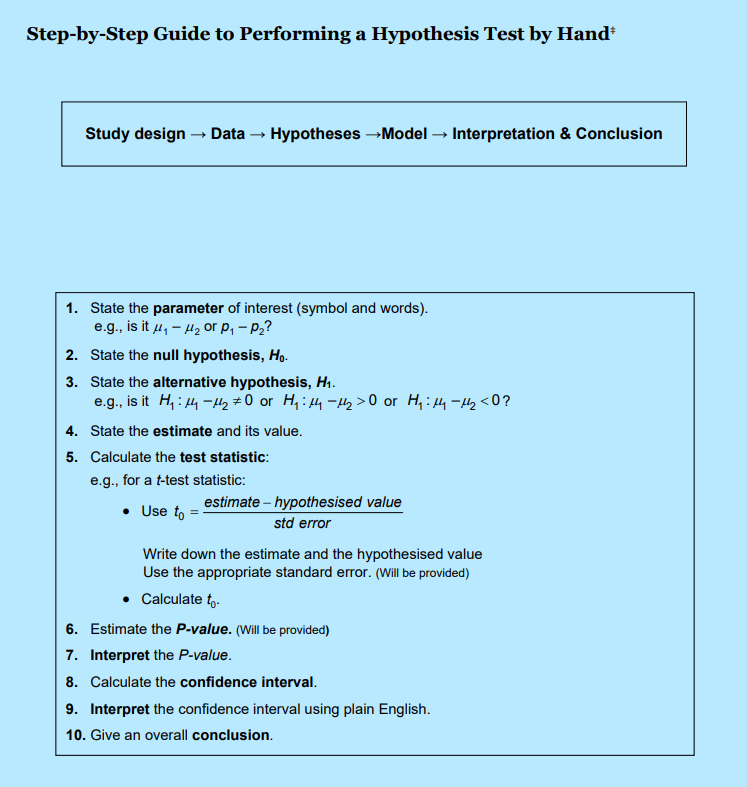
Question 3. Computer output from SPSS for use in Question 3 (d) Van Der Bergh et al. (2011)" conducted a study about the use of Facebook by students. A random sample of students from a small university in the United States were contacted via email and asked to Choose from EITHER Independent Samples Test complete a survey. One question asked students how much time they spent per day on Facebook. OR Paired Samples Test Students who completed the survey were then sent another email which asked them to install software on their computer which monitored the time they spent on Facebook Of the 110 students who completed he survey, 45 installed the monitoring software on their computer. For these 45 students, the time (in minutes) each student said they spent on Facebook each day (as reported by the student in the survey) was recorded, as was the time (in minutes) each student actually spent on Facebook each day (as measured by the monitoring software). Group Statistics The researchers were interested in whether there was a difference between the self-reported time and Group Mean Sid. Deviation Sid. Error Mean the actual time, on average. Time SelfReported 45 148.89 107.344 16.002 (a) For this study describe the: Actual 45 26.62 28.590 4.263 (i) units, (ii) treatment or factor of interest, Independent Samples Test (iii) response. Levene's Test for Equality of (b) Which form of statistical analysis should be used to investigate this data? Variances 1-test for Equality of Means For your answer, write down EITHER A two-independent sample t-test 95% Confidence OR A paired data t-test Interval of the Mean Sid. Error Difference (c) (i) Use iNZight to draw the appropriate plot(s) for this study. F Sig di Sig. (2-tailed) Difference Difference Lower Upper Time Equal variances 26.351 88 000 122.267 16.560 89.357 155.176 You will need to choose EITHER FacebookDatal . CSV assumed 000 7.383 OR FacebookData2 . CSV Equal variances 7.383 50.214 000 122.267 16.560 89.009 155.525 not assumed You may need to manipulate the data prior to drawing your plot(s). [Hint: Consider how the data should be arranged given the answer you chose for (b). ] (ii) Comment on any features in the plot(s) in terms of the original story. (d) Investigate whether there was a difference between the self-reported time and the actual time, on average. Use the appropriate f-test computer output from SPSS given to the right to conduct Paired Samples Statistics the t-test you chose in (b). Interpret your results. Mean Sid. Deviation Std. Error Mean Notes: Pair 1 SelfReported 148.89 45 107.344 16.002 You must clearly show that you have followed Steps 1, 2, 3, 7, 9 and 10 in the "Step-by- Actual 45 Step Guide to Performing a Hypothesis Test by Hand" 26.62 28.596 4.263 Paired Samples Test Paired Differences 95% Confidence Interval (e) Comment on the validity of the -procedures conducted in (d) by briefly discussing each Std. Error of the Difference assumption in terms of the original story. Mean Std. Deviation Mean Lower Upper df Sig. (2-tailed) Pair 1 SelfReported - Actual 122.267 93.461 13.932 94 188 150.346 8.776 44 000A B 1 Time Group 118 Actual 102 Actual 4 105 Actual 5 81 Actual 72 Actual -J 63 Actual 8 48 Actual 9 39 Actual 10 40 Actual 11 37 Actual 12 26 Actual 13 29 Actual 14 31 Actual 15 31 Actual 16 30 Actual 17 22 Actual 18 20 Actual 19 18 Actual 20 19 Actual 21 8 Actual 22 10 Actual 23 14 Actual 24 15 Actual 25 16 Actual 26 17 Actual 27 16 Actual 28 9 Actual 29 10 Actual 30 10 Actual 31 4 Actual 32 10 Actual 33 8 Actual 34 8 Actual 35 4 Actual 36 3 Actual 37 2 Actual 38 1 Actual 39 1 Actual 40 1 Actual 41 2 Actual 42 18 Actual 43 17 Actual 44 22 Actual 45 31 Actual46 10 Actual 47 145 SelfReported 48 295 SelfReported 49 540 SelfReported 50 348 SelfReported 51 149 SelfReported 52 265 SelfReported 53 171 SelfReported 54 97 SelfReported 55 324 SelfReported 56 172 SelfReported 57 171 SelfReported 58 300 SelfReported 59 150 SelfReported 60 128 SelfReported 61 120 SelfReported 62 68 SelfReported 63 81 Self Reported 64 8 Self Reported 65 273 SelfReported 56 314 Self Reported 67 301 SelfReported 68 180 SelfReported 69 180 SelfReported 70 120 SelfReported 71 120 SelfReported 89 Self Reported 120 SelfReported 74 151 SelfReported 75 72 SelfReported 76 118 SelfReported 17 10 SelfReported 78 6 SelfReported 79 22 SelfReported 80 70 SelfReported 81 60 SelfReported 82 75 SelfReported 83 70 SelfReported 84 69 SelfReported 85 65 SelfReported 86 74 SelfReported 87 120 SelfReported 68 120 SelfReported 89 68 SelfReported 150 SelfReported 91 151 SelfReportedStep-by-Step Guide to Performing a Hypothesis Test by Hand Study design - Data - Hypotheses -Model - Interpretation & Conclusion 1. State the parameter of interest (symbol and words). e.g., is it # - #2 or P1 - P2? 2. State the null hypothesis, Ho. 3. State the alternative hypothesis, H1. e.g., is it Hy : 4 -12 = 0 or Hy: 1 -12 20 or Hy: 1 -12
Step by Step Solution
There are 3 Steps involved in it
Step: 1
Get Instant Access to Expert-Tailored Solutions
See step-by-step solutions with expert insights and AI powered tools for academic success
Step: 2
Step: 3
Ace Your Homework with AI
Get the answers you need in no time with our AI-driven, step-by-step assistance