Question
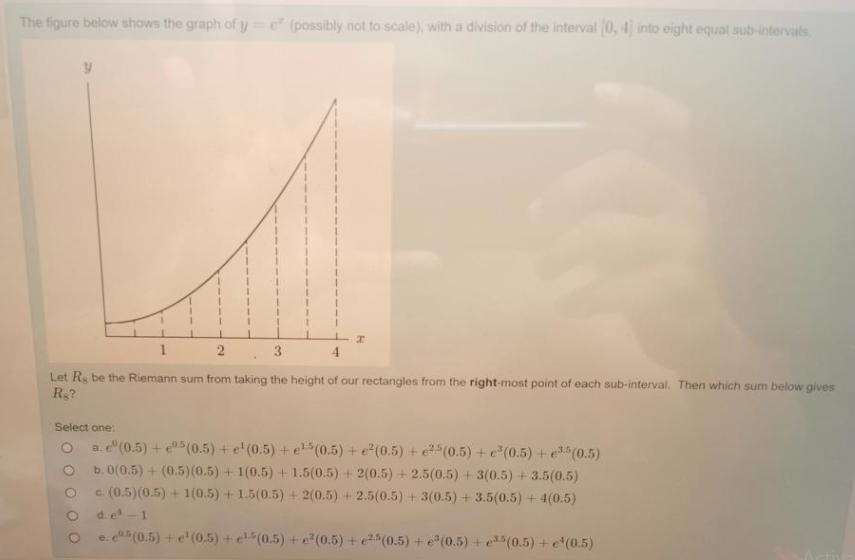
The figure below shows the graph of y=e (possibly not to scale), with a division of the interval 0, 4 into eight equal sub-intervats

The figure below shows the graph of y=e (possibly not to scale), with a division of the interval 0, 4 into eight equal sub-intervats 4. Let R. be the Riemann sum from taking the height of our rectangles from the right-most point of each sub-interval. Then which sum below gives R&? Select one: O ae"(0.5) + (0.5) + e'(0.5) +el (0.5) +e2(0.5) + e(0.5) +e (0.5) +e (0.5) b. 0(0.5) + (0.5)(0.5) + 1(0.5) + 1.5(0.5) + 2(0.5) ++ 2.5(0.5) + 3(0.5) +3.5(0.5) c. (0.5) (0.5) + 1(0.5) + 1.5(0.5) + 2(0.5) +2.5(0.5) +3(0.5) + 3.5(0.5) + 4(0.5) d. e-1 O e.(0.5) +e'(0.5) + e(0.5) + e(0.5) +e (0.5) +e(0.5) +e(0.5) +e(0.5)
Step by Step Solution
3.50 Rating (160 Votes )
There are 3 Steps involved in it
Step: 1
Riemann sum for 0 4 e x dx with n8 rectangles using right end...
Get Instant Access to Expert-Tailored Solutions
See step-by-step solutions with expert insights and AI powered tools for academic success
Step: 2

Step: 3

Ace Your Homework with AI
Get the answers you need in no time with our AI-driven, step-by-step assistance
Get StartedRecommended Textbook for
Algebra and Trigonometry
Authors: Ron Larson
10th edition
9781337514255, 1337271179, 133751425X, 978-1337271172
Students also viewed these Mathematics questions
Question
Answered: 1 week ago
Question
Answered: 1 week ago
Question
Answered: 1 week ago
Question
Answered: 1 week ago
Question
Answered: 1 week ago
Question
Answered: 1 week ago
Question
Answered: 1 week ago
Question
Answered: 1 week ago
Question
Answered: 1 week ago
Question
Answered: 1 week ago
Question
Answered: 1 week ago
Question
Answered: 1 week ago
Question
Answered: 1 week ago
Question
Answered: 1 week ago
Question
Answered: 1 week ago
Question
Answered: 1 week ago
Question
Answered: 1 week ago
Question
Answered: 1 week ago
Question
Answered: 1 week ago
Question
Answered: 1 week ago
Question
Answered: 1 week ago
Question
Answered: 1 week ago
View Answer in SolutionInn App


