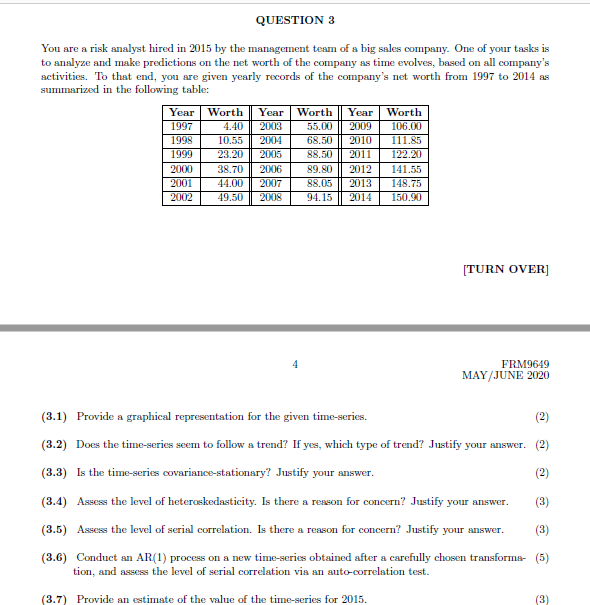
QUESTION 3 You are a risk analyst hired in 2015 by the management team of a big sales company. One of your tasks is to analyze and make predictions on the net worth of the company as time evolves, based on all company's activities. To that end, you are given yearly records of the company's net worth from 1997 to 2014 as summarized in the following table: Year Worth Year Worth Year Worth 1997 4.40 2003 55.00 2009 106.00 1998 10.55 2004 68.50 2010 111.85 1999 23.20 2005 88.50 2011 122.20 2000 38.70 2006 89,90 2012 141.55 2001 44.00 2007 88.05 2013 148.75 2002 49.50 2008 94.15 2014 150.90 [TURN OVER] FRM9649 MAY/JUNE 2020 2 (3.1) Provide a graphical representation for the given time-series. (3.2) Does the time-series seem to follow a trend? If yes, which type of trend? Justify your answer. (2) (3.3) Is the time-series covariance-stationary? Justify your answer. (3.4) Assess the level of heteroskedasticity. Is there a reason for concern? Justify your answer. (3) (3.5) Assess the level of serial correlation. Is there a reason for concern? Justify your answer. (3) (3.6) Conduct an AR(1) process on a new time-series obtained after a carefully chosen transforma- (5) tion, and assess the level of serial correlation via an auto-correlation test. (3.7) Provide an estimate of the value of the time-series for 2015. (3) QUESTION 3 You are a risk analyst hired in 2015 by the management team of a big sales company. One of your tasks is to analyze and make predictions on the net worth of the company as time evolves, based on all company's activities. To that end, you are given yearly records of the company's net worth from 1997 to 2014 as summarized in the following table: Year Worth Year Worth Year Worth 1997 4.40 2003 55.00 2009 106.00 1998 10.55 2004 68.50 2010 111.85 1999 23.20 2005 88.50 2011 122.20 2000 38.70 2006 89,90 2012 141.55 2001 44.00 2007 88.05 2013 148.75 2002 49.50 2008 94.15 2014 150.90 [TURN OVER] FRM9649 MAY/JUNE 2020 2 (3.1) Provide a graphical representation for the given time-series. (3.2) Does the time-series seem to follow a trend? If yes, which type of trend? Justify your answer. (2) (3.3) Is the time-series covariance-stationary? Justify your answer. (3.4) Assess the level of heteroskedasticity. Is there a reason for concern? Justify your answer. (3) (3.5) Assess the level of serial correlation. Is there a reason for concern? Justify your answer. (3) (3.6) Conduct an AR(1) process on a new time-series obtained after a carefully chosen transforma- (5) tion, and assess the level of serial correlation via an auto-correlation test. (3.7) Provide an estimate of the value of the time-series for 2015. (3)