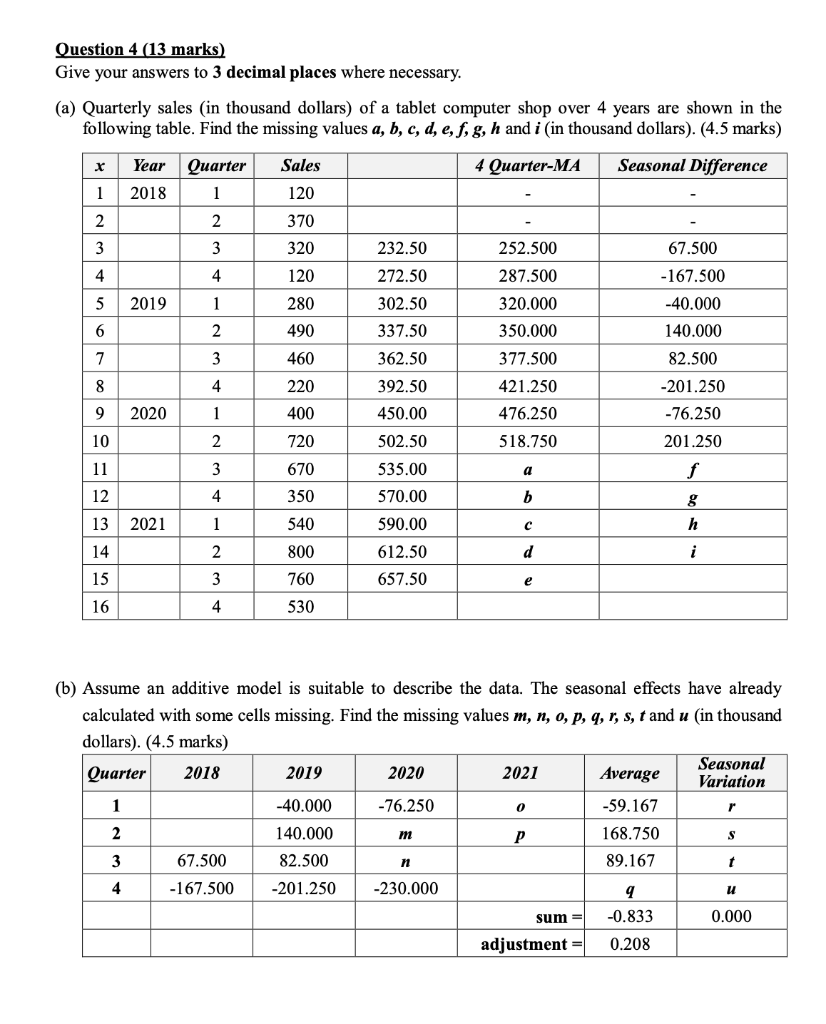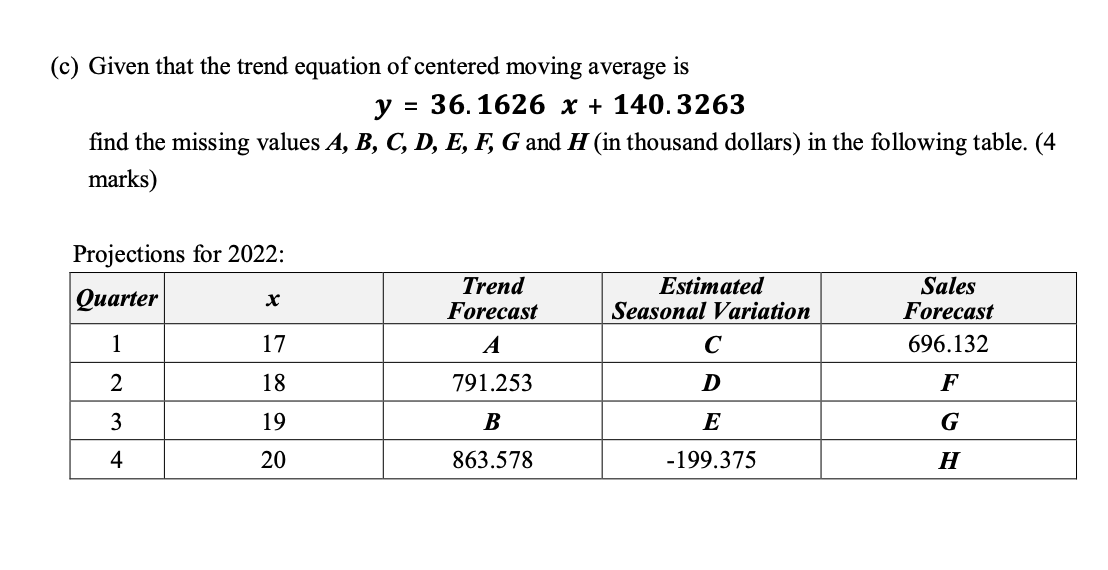

Question 4 (13 marks) Give your answers to 3 decimal places where necessary. (a) Quarterly sales in thousand dollars) of a tablet computer shop over 4 years are shown in the following table. Find the missing values a, b, c, d, e, f, g, h and i (in thousand dollars). (4.5 marks) X Year Quarter 4 Quarter-MA Seasonal Difference Sales 120 1 2018 1 2 2 370 3 3 320 4 4 120 5 2019 1 280 6 67.500 -167.500 -40.000 140.000 82.500 2 232.50 272.50 302.50 337.50 362.50 392.50 450.00 490 252.500 287.500 320.000 350.000 377.500 421.250 476.250 518.750 7 3 460 8 4 220 9 2020 400 -201.250 -76.250 201.250 f 1 2 3 10 720 670 502.50 535.00 11 a 12 4 570.00 b 350 540 13 2021 1 g h i 14 800 590.00 612.50 657.50 2 3 d 15 760 e 16 4 530 0 r (b) Assume an additive model is suitable to describe the data. The seasonal effects have already calculated with some cells missing. Find the missing values m, n, o, p, q, r, s, t and u (in thousand dollars). (4.5 marks) Seasonal Quarter 2018 2019 2020 2021 Average Variation 1 -40.000 -76.250 -59.167 2 140.000 m 168.750 S 3 67.500 82.500 89.167 4 -167.500 -201.250 -230.000 9 sum = -0.833 0.000 adjustment = 0.208 11 f = (c) Given that the trend equation of centered moving average is y = 36. 1626 x + 140.3263 find the missing values A, B, C, D, E, F, G and H (in thousand dollars) in the following table. (4 marks) Projections for 2022: Quarter X Trend Forecast A Estimated Seasonal Variation C Sales Forecast 696.132 1 17 2 18 791.253 D F 3 19 B E G 4 20 863.578 -199.375 H Question 4 (13 marks) Give your answers to 3 decimal places where necessary. (a) Quarterly sales in thousand dollars) of a tablet computer shop over 4 years are shown in the following table. Find the missing values a, b, c, d, e, f, g, h and i (in thousand dollars). (4.5 marks) X Year Quarter 4 Quarter-MA Seasonal Difference Sales 120 1 2018 1 2 2 370 3 3 320 4 4 120 5 2019 1 280 6 67.500 -167.500 -40.000 140.000 82.500 2 232.50 272.50 302.50 337.50 362.50 392.50 450.00 490 252.500 287.500 320.000 350.000 377.500 421.250 476.250 518.750 7 3 460 8 4 220 9 2020 400 -201.250 -76.250 201.250 f 1 2 3 10 720 670 502.50 535.00 11 a 12 4 570.00 b 350 540 13 2021 1 g h i 14 800 590.00 612.50 657.50 2 3 d 15 760 e 16 4 530 0 r (b) Assume an additive model is suitable to describe the data. The seasonal effects have already calculated with some cells missing. Find the missing values m, n, o, p, q, r, s, t and u (in thousand dollars). (4.5 marks) Seasonal Quarter 2018 2019 2020 2021 Average Variation 1 -40.000 -76.250 -59.167 2 140.000 m 168.750 S 3 67.500 82.500 89.167 4 -167.500 -201.250 -230.000 9 sum = -0.833 0.000 adjustment = 0.208 11 f = (c) Given that the trend equation of centered moving average is y = 36. 1626 x + 140.3263 find the missing values A, B, C, D, E, F, G and H (in thousand dollars) in the following table. (4 marks) Projections for 2022: Quarter X Trend Forecast A Estimated Seasonal Variation C Sales Forecast 696.132 1 17 2 18 791.253 D F 3 19 B E G 4 20 863.578 -199.375 H


