

Answered step by step
Verified Expert Solution
Question
1 Approved Answer
Question 4 : Complete the following table and draw a graph showing how bond price for each bond changes over time as they move towards
Question :
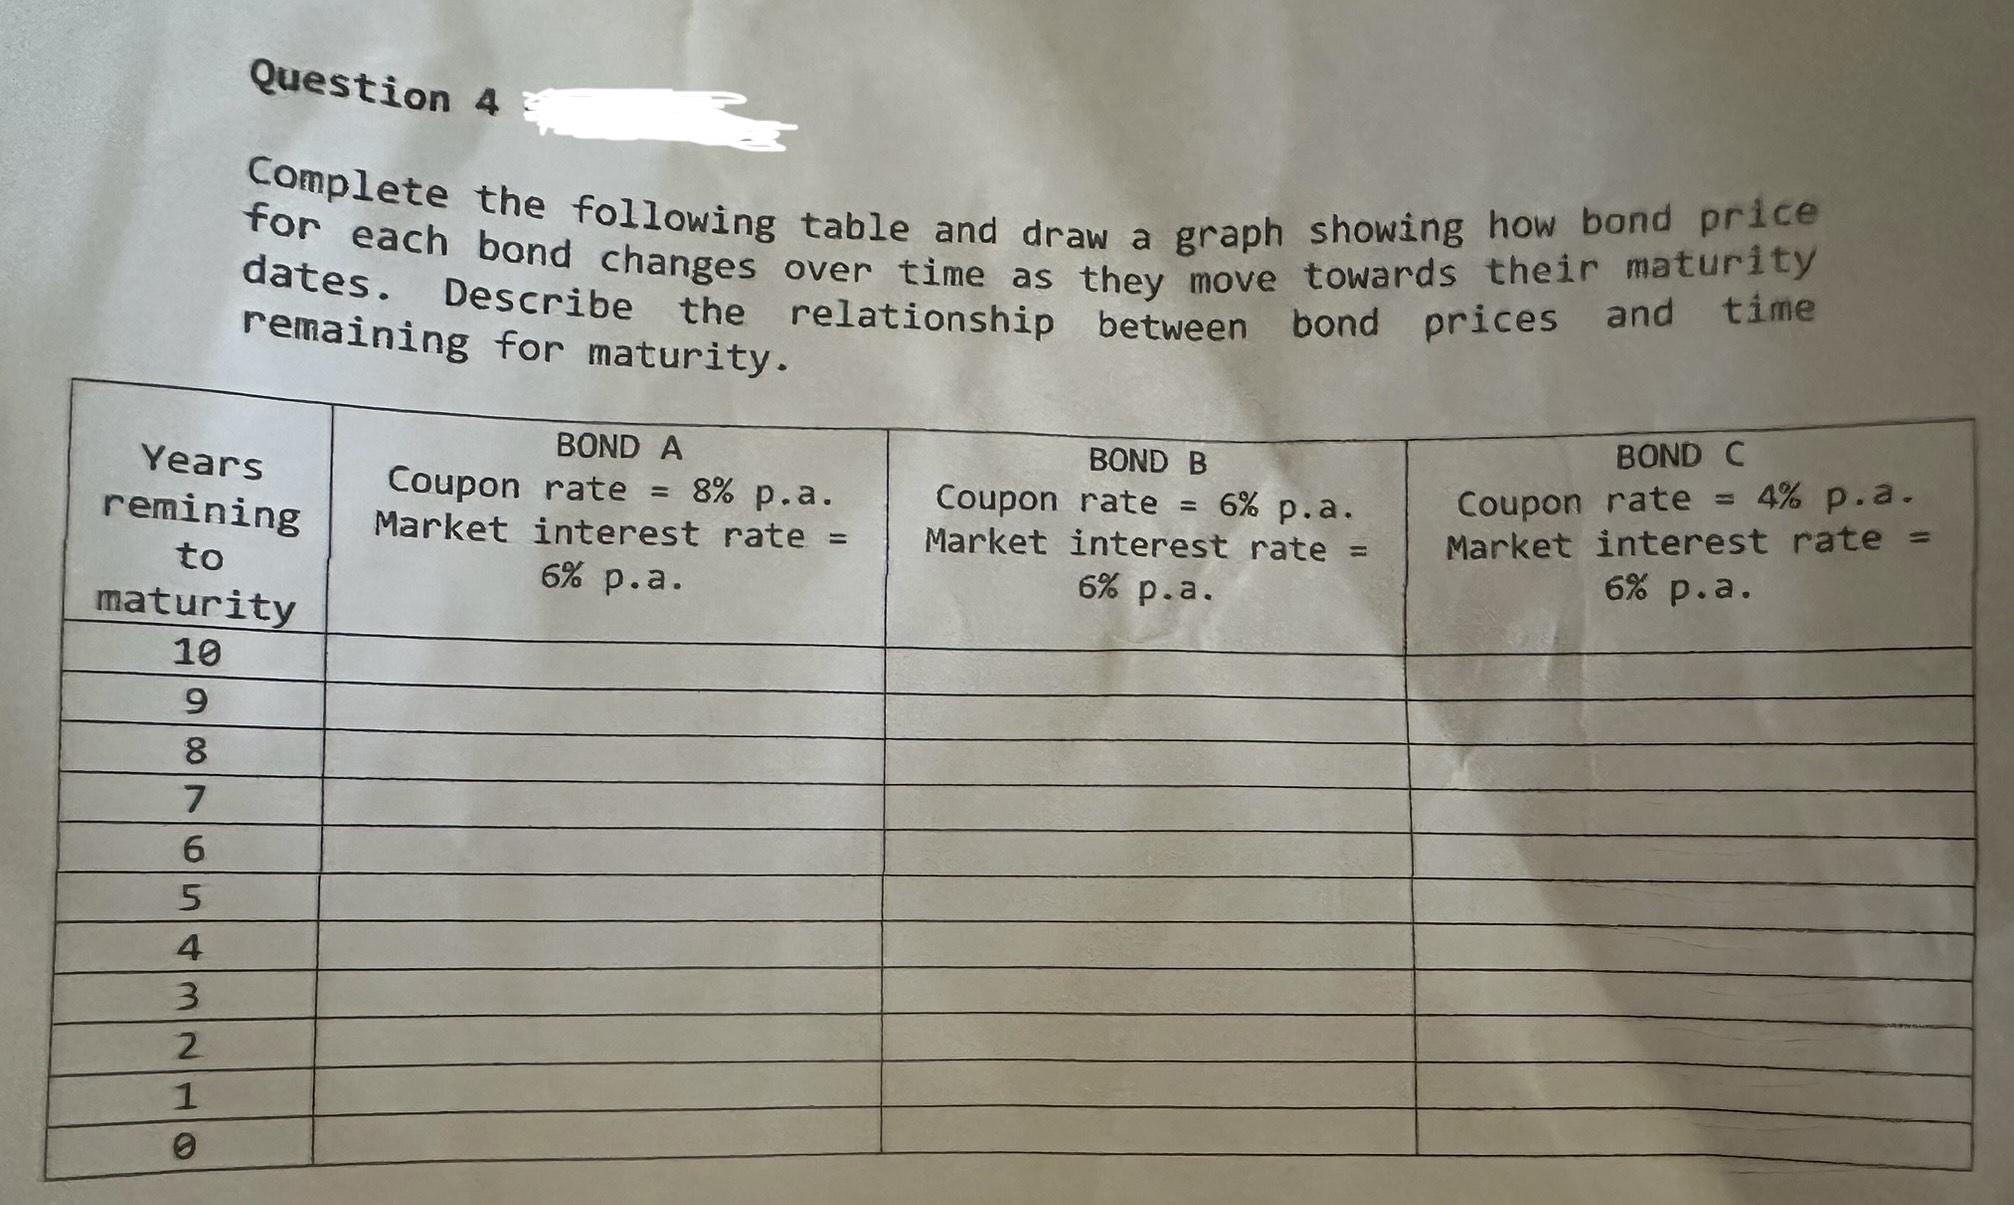
Complete the following table and draw a graph showing how bond price
for each bond changes over time as they move towards their maturity
dates. Describe the relationship between bond prices and time
remaining for maturity.
Step by Step Solution
There are 3 Steps involved in it
Step: 1

Get Instant Access to Expert-Tailored Solutions
See step-by-step solutions with expert insights and AI powered tools for academic success
Step: 2

Step: 3
Ace Your Homework with AI
Get the answers you need in no time with our AI-driven, step-by-step assistance
Get Started
Financial Management For Technology Start Ups
Authors: Alnoor Bhimani
2nd Edition
1398603082, 978-1398603080