Question 4 (EXCEL): Estimation of Expected Return and Variance/Covariance Matrix
ONLY ANSWER PART 3
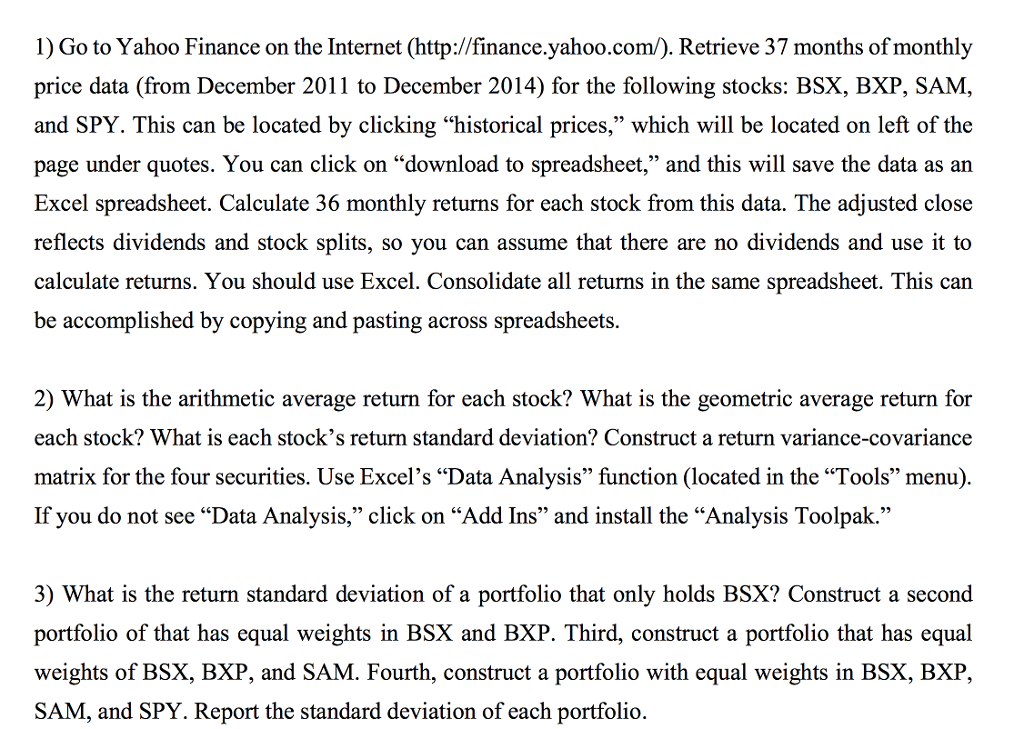
1) Go to Yahoo Finance on the Internet (http://finance.yahoo.com/O. Retrieve 37 months ofmonthly price data (from December 2011 to December 2014) for the following stocks: BSX, BXP, SAM and SPY. This can be located by clicking "historical prices which will be located on left of the page under quotes. You can click on "download to spreadsheet," and this will save the data as an Excel spreadsheet. Calculate 36 monthly returns for each stock from this data. The adjusted close reflects dividends and stock splits, so you can assume that there are no dividends and use it to calculate returns. You should use Excel. Consolidate all returns in the same spreadsheet. This can be accomplished by copying and pasting across spreadsheets. 2) What is the arithmetic average return for each stock? What is the geometric average return for each stock? What is each stock's return standard deviation? Construct a return variance-covariance matrix for the four securities. Use Excel's "Data Analysis" function (located in the "Tools" menu) If you do not see "Data Analysis click on "Add Ins" and install the "Analysis Toolpak." 3) What is the return standard deviation of a portfolio that only holds BSX? Construct a second portfolio of that has equal weights in BSX and BXP. Third, construct a portfolio that has equal weights of BSX, BXP, and SAM. Fourth, construct a portfolio with equal weights in BSX, BXP SAM, and SPY. Report the standard deviation of each portfolio 1) Go to Yahoo Finance on the Internet (http://finance.yahoo.com/O. Retrieve 37 months ofmonthly price data (from December 2011 to December 2014) for the following stocks: BSX, BXP, SAM and SPY. This can be located by clicking "historical prices which will be located on left of the page under quotes. You can click on "download to spreadsheet," and this will save the data as an Excel spreadsheet. Calculate 36 monthly returns for each stock from this data. The adjusted close reflects dividends and stock splits, so you can assume that there are no dividends and use it to calculate returns. You should use Excel. Consolidate all returns in the same spreadsheet. This can be accomplished by copying and pasting across spreadsheets. 2) What is the arithmetic average return for each stock? What is the geometric average return for each stock? What is each stock's return standard deviation? Construct a return variance-covariance matrix for the four securities. Use Excel's "Data Analysis" function (located in the "Tools" menu) If you do not see "Data Analysis click on "Add Ins" and install the "Analysis Toolpak." 3) What is the return standard deviation of a portfolio that only holds BSX? Construct a second portfolio of that has equal weights in BSX and BXP. Third, construct a portfolio that has equal weights of BSX, BXP, and SAM. Fourth, construct a portfolio with equal weights in BSX, BXP SAM, and SPY. Report the standard deviation of each portfolio


