

Answered step by step
Verified Expert Solution
Question
1 Approved Answer
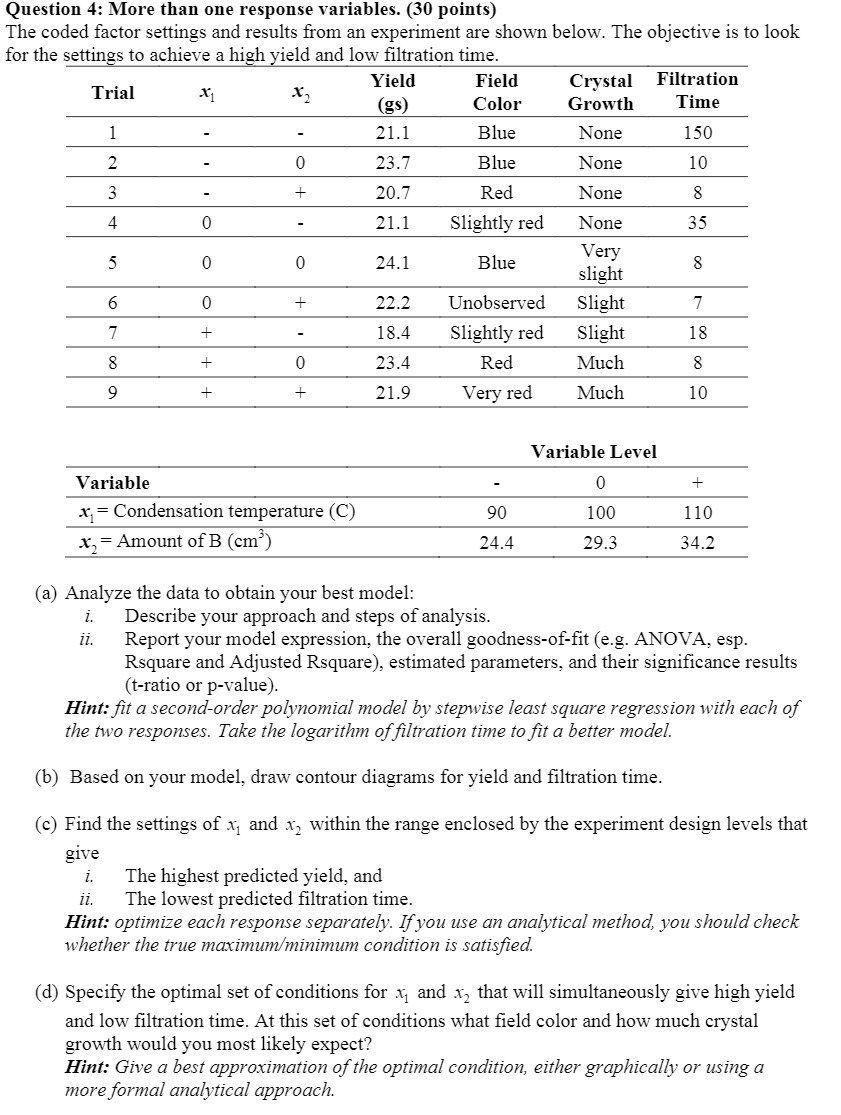
Question 4: More than one response variables. (30 points) The coded factor settings and results from an experiment are shown below. The objective is to

Step by Step Solution
There are 3 Steps involved in it
Step: 1

Get Instant Access to Expert-Tailored Solutions
See step-by-step solutions with expert insights and AI powered tools for academic success
Step: 2

Step: 3
Ace Your Homework with AI
Get the answers you need in no time with our AI-driven, step-by-step assistance
Get Started
Advances In Mathematical Economics Volume 19
Authors: Shigeo Kusuoka, Toru Maruyama
1st Edition
4431554890, 9784431554899