Answered step by step
Verified Expert Solution
Link Copied!

Question

1 Approved Answer

Question 4) The table below figure shows the levels of output resulting from can be drawn from this information? 1) determine where does the firm
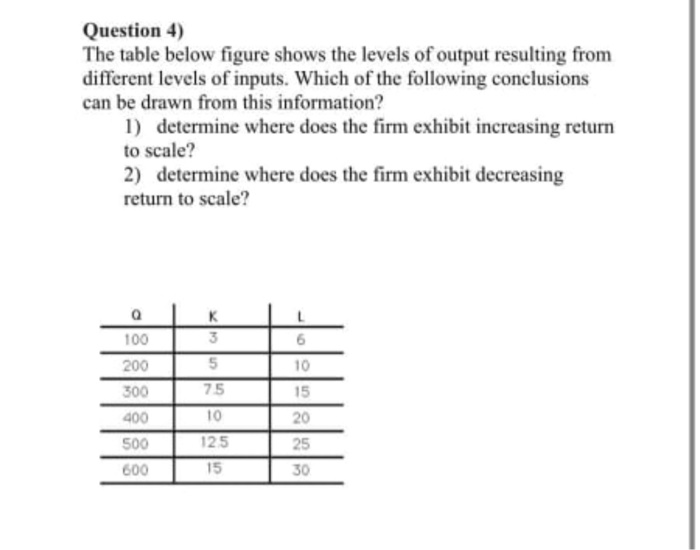
image text in transcribed
Question 4) The table below figure shows the levels of output resulting from can be drawn from this information? 1) determine where does the firm exhibit increasing return to scale? 2) determine where does the firm exhibit decreasing return to scale? 15 100T36 2005 300 75 400 T 10 500125 600 15

Step by Step Solution

There are 3 Steps involved in it

Step: 1

blur-text-image

Get Instant Access to Expert-Tailored Solutions

See step-by-step solutions with expert insights and AI powered tools for academic success

Step: 2

blur-text-image_2

Step: 3

blur-text-image_3

Ace Your Homework with AI

Get the answers you need in no time with our AI-driven, step-by-step assistance

Get Started

Recommended Textbook for

More Books

Students also viewed these Finance questions

Question

true or false: all plays follow the structure of freytag's pyram

Answered: 1 week ago

Question

How much sales tax did Dillards pay in South Carolina (SC)?

Answered: 1 week ago