

Answered step by step
Verified Expert Solution
Question
1 Approved Answer
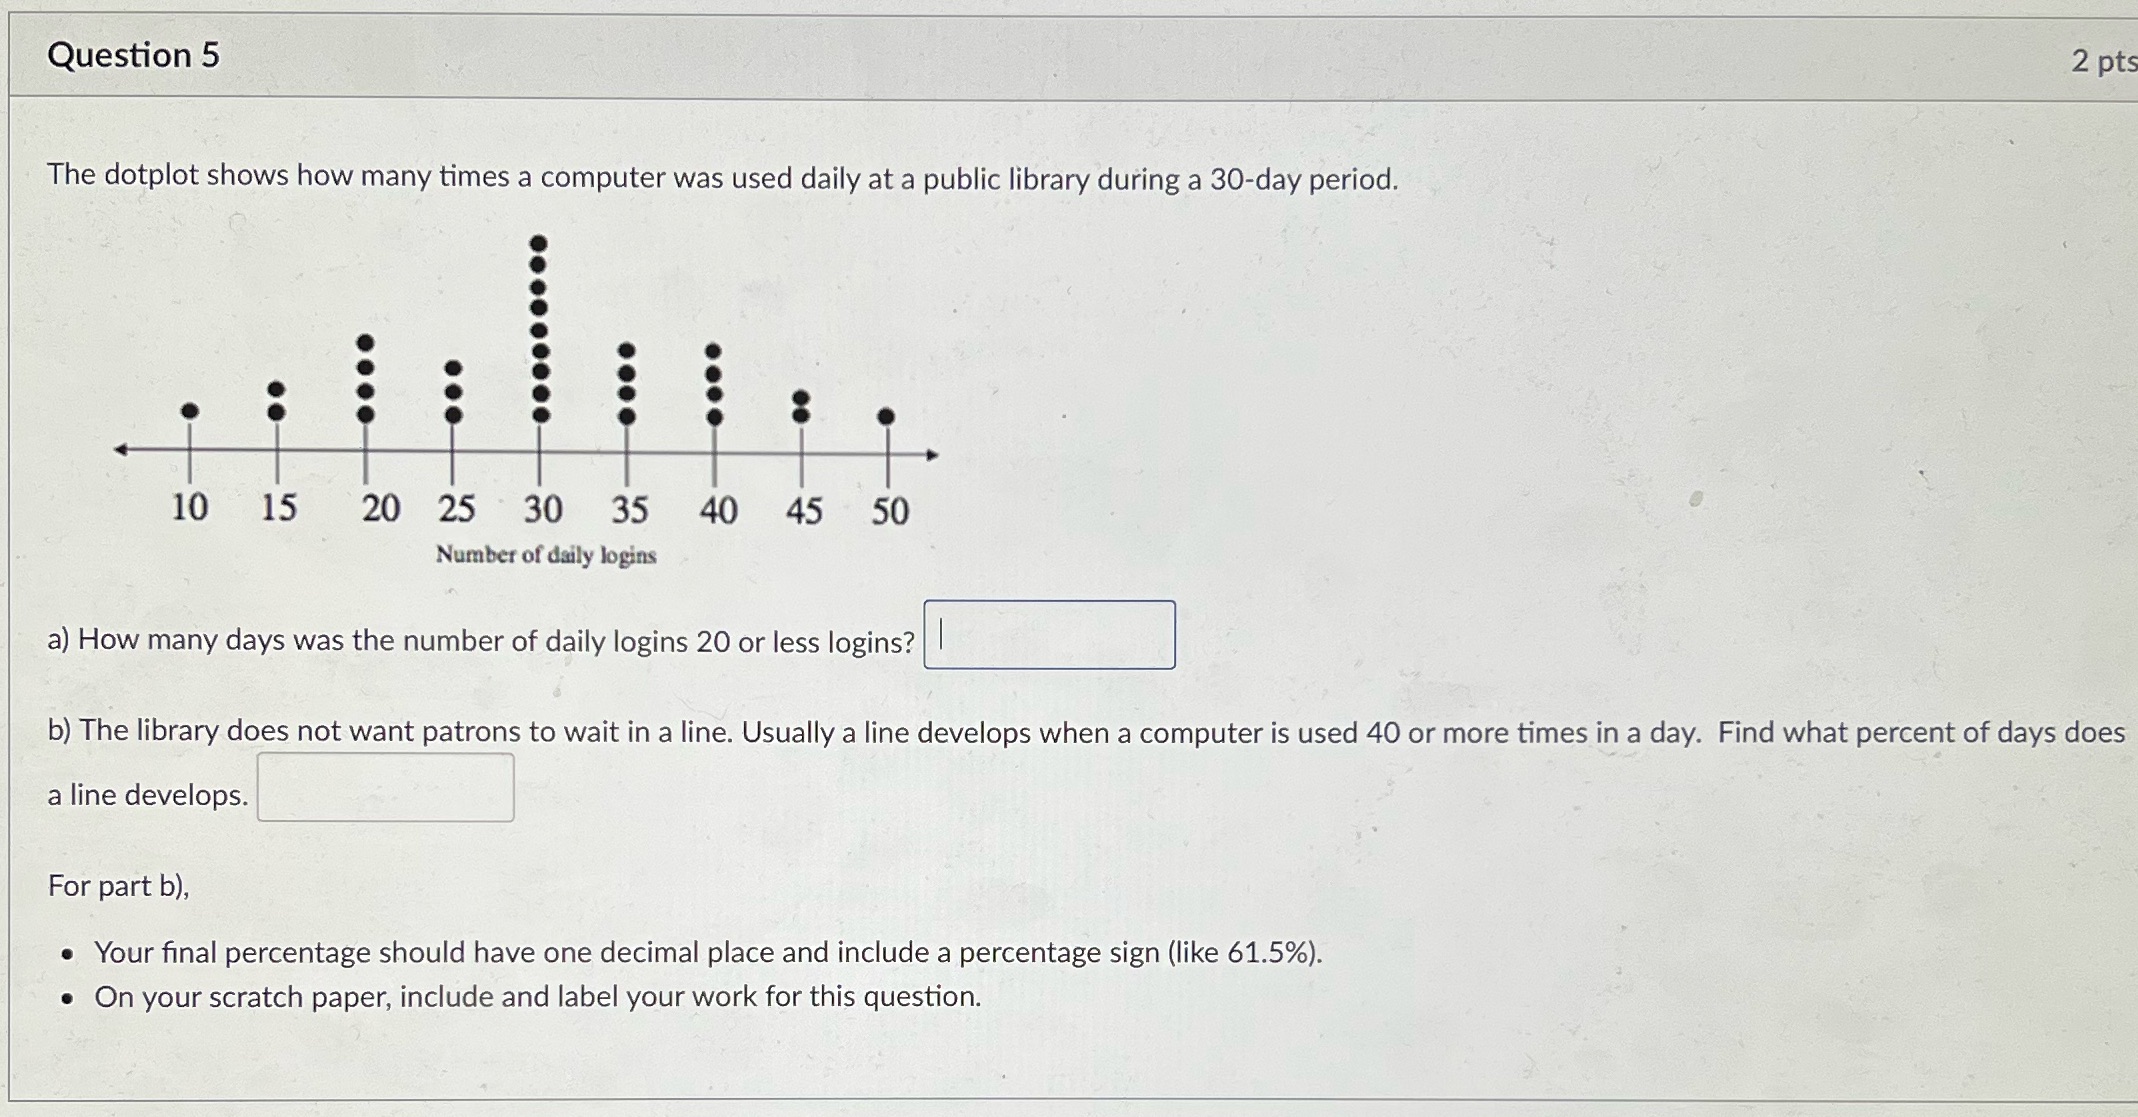
Question 5 2 pt The dotplot shows how many times a computer was used daily at a public library during a 30-day period. ..... ..
Step by Step Solution
There are 3 Steps involved in it
Step: 1

Get Instant Access to Expert-Tailored Solutions
See step-by-step solutions with expert insights and AI powered tools for academic success
Step: 2

Step: 3
Ace Your Homework with AI
Get the answers you need in no time with our AI-driven, step-by-step assistance
Get Started
College Algebra
Authors: Michael Sullivan
10th Edition
0321999428, 9780321999429