Question
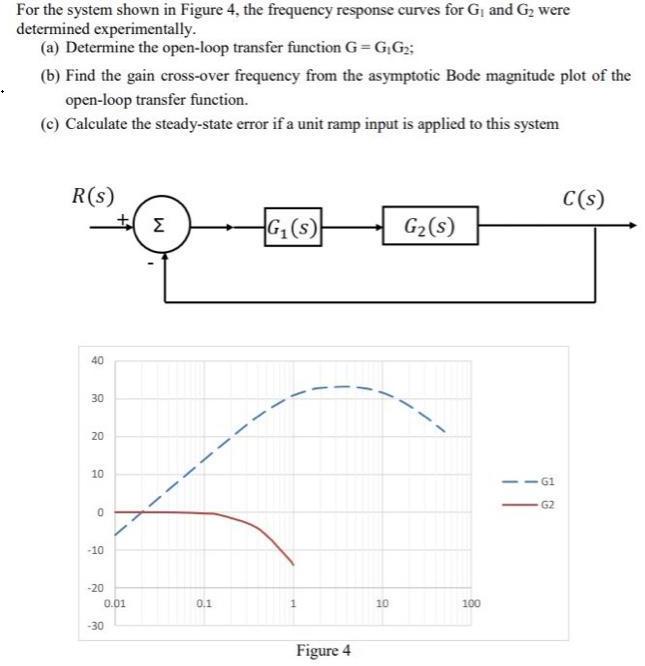
For the system shown in Figure 4, the frequency response curves for Gj and G2 were determined experimentally. (a) Determine the open-loop transfer function

For the system shown in Figure 4, the frequency response curves for Gj and G2 were determined experimentally. (a) Determine the open-loop transfer function G = G,G;; (b) Find the gain cross-over frequency from the asymptotic Bode magnitude plot of the open-loop transfer function. (c) Calculate the steady-state error if a unit ramp input is applied to this system R(s) C(s) G,(s) G2(s) 40 30 20 10 G1 -10 -20 0.01 0.1 10 100 -30 Figure 4
Step by Step Solution
There are 3 Steps involved in it
Step: 1

Get Instant Access to Expert-Tailored Solutions
See step-by-step solutions with expert insights and AI powered tools for academic success
Step: 2

Step: 3

Ace Your Homework with AI
Get the answers you need in no time with our AI-driven, step-by-step assistance
Get StartedRecommended Textbook for
Modern Control Systems
Authors: Richard C. Dorf, Robert H. Bishop
12th edition
136024580, 978-0136024583
Students also viewed these Computer Network questions
Question
Answered: 1 week ago
Question
Answered: 1 week ago
Question
Answered: 1 week ago
Question
Answered: 1 week ago
Question
Answered: 1 week ago
Question
Answered: 1 week ago
Question
Answered: 1 week ago
Question
Answered: 1 week ago
Question
Answered: 1 week ago
Question
Answered: 1 week ago
Question
Answered: 1 week ago
Question
Answered: 1 week ago
Question
Answered: 1 week ago
Question
Answered: 1 week ago
Question
Answered: 1 week ago
Question
Answered: 1 week ago
Question
Answered: 1 week ago
Question
Answered: 1 week ago
Question
Answered: 1 week ago
Question
Answered: 1 week ago
Question
Answered: 1 week ago
Question
Answered: 1 week ago
View Answer in SolutionInn App


