Answered step by step
Verified Expert Solution
Question
1 Approved Answer
Question 5 (20 marks) In the bustling town of Economica, ten households were se- lected for an insightful study aimed at uncovering the relationship between
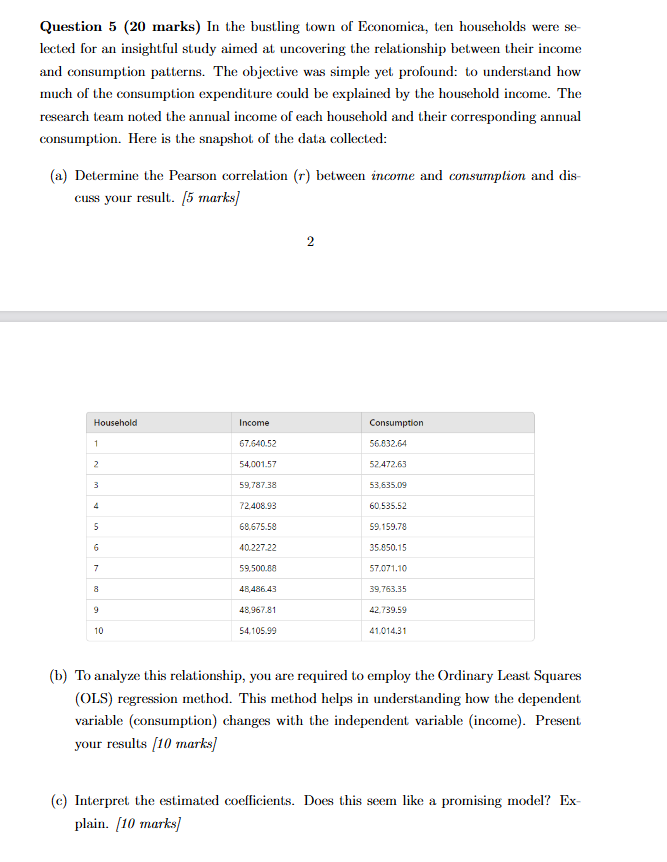
Question 5 (20 marks) In the bustling town of Economica, ten households were se- lected for an insightful study aimed at uncovering the relationship between their income and consumption patterns. The objective was simple yet profound: to understand how much of the consumption expenditure could be explained by the household income. The research team noted the annual income of each household and their corresponding annual consumption. Here is the snapshot of the data collected: (a) Determine the Pearson correlation (r) between income and consumption and dis- cuss your result. 5 marks) 2 Household Income Consumption 67.640.52 56 032.64 2 54,001.57 52.472.63 3 59,787.38 53,635.09 4 72,408.93 60.535.52 68.675.58 59.159.78 40.227-22 35.950,15 59.500.88 57.071.10 48,486.43 39,763.35 9 48,967 81 42,739.59 10 54,105.99 41,014.31 (b) To analyze this relationship, you are required to employ the Ordinary Least Squares (OLS) regression method. This method helps in understanding how the dependent variable (consumption) changes with the independent variable (income). Present your results (10 marks) (c) Interpret the estimated coefficients. Does this seem like a promising model? Ex- plain. (10 marks)
Step by Step Solution
There are 3 Steps involved in it
Step: 1
Get Instant Access to Expert-Tailored Solutions
See step-by-step solutions with expert insights and AI powered tools for academic success
Step: 2
Step: 3
Ace Your Homework with AI
Get the answers you need in no time with our AI-driven, step-by-step assistance
Get Started