

Question
Question 5 5 Points Based on the following data, determine the Net Cash flows from Operations. Cash dividend $9,800 Increase in Accounts Receivable $2,239 Decrease
Question 5
5 Points
| Based on the following data, determine the Net Cash flows from Operations. | |
| Cash dividend | $9,800 |
| Increase in Accounts Receivable | $2,239 |
| Decrease in. Inventory | $798 |
| Interest paid on long term debt | $2,500 |
| Increase in Other Current Assets | $2,408 |
| Depreciation Expense | $8,413 |
| Repurchase of stock | $1,270 |
| Increase in Accounts Payable | $6,781 |
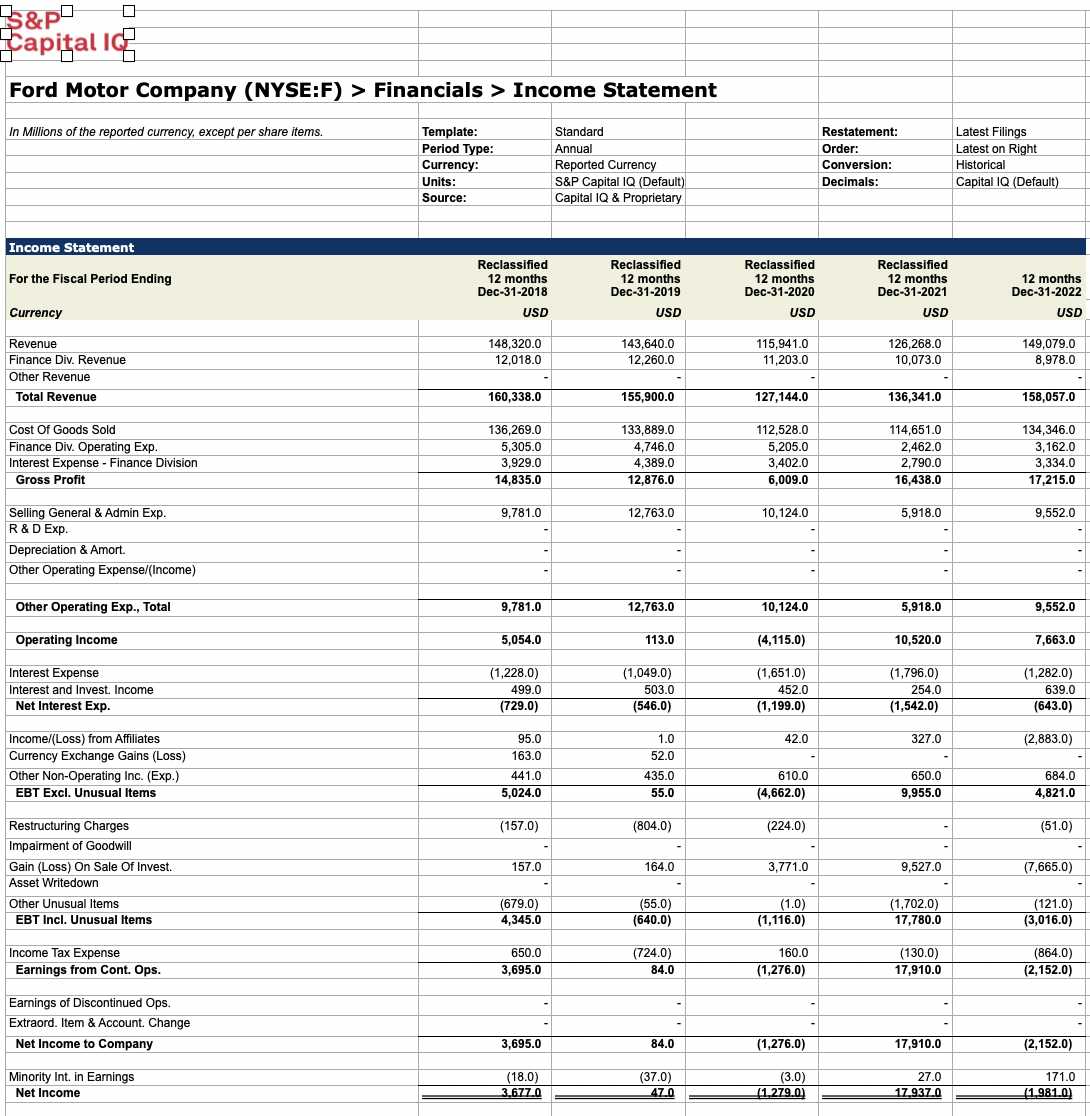
| Net Income | $3,677 |
| Cash collections from current customers | $4,800 |
What is the Net Cash Flow from Operating Activities?
Net Cash Flow from Operating Activities = $27,322
Net Cash Flow from Operating Activities = $15.022
Net Cash Flow from Operating Activities = $12,522
Net Cash Flow from Operating Activities = $19,822
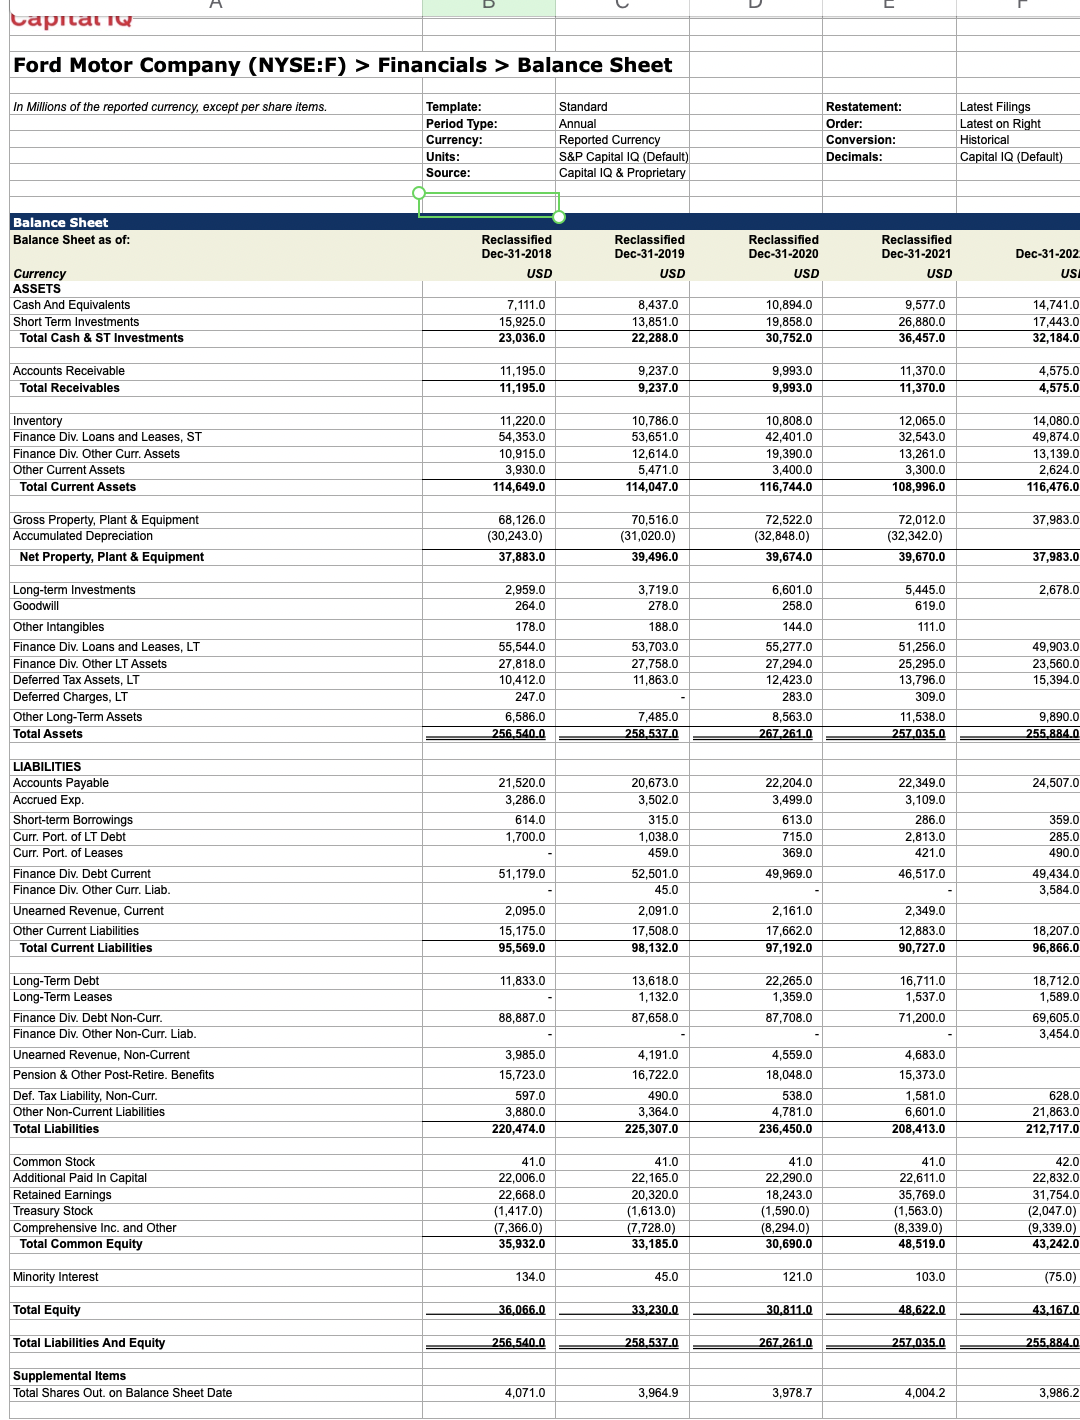
\begin{tabular}{|c|c|c|c|c|c|} \hline & & & & & \\ \hline Capr & & & & & \\ \hline Ford Motor Company (NYSE:F & incials > Bal & ance Sheet & & & \\ \hline & & & & & \\ \hline In Millions of the reported currency, except per share items. & Template: & Standard & & Restatement: & Latest Filings \\ \hline & Period Type: & Annual & & Order: & Latest on Right \\ \hline & Currency: & Reported Currency & & Conversion: & Historical \\ \hline & Units: & S\&P Capital IQ (Default) & & Decimals: & Capital IQ (Default) \\ \hline & Source: & Capital IQ \& Proprietary & & & \\ \hline & & & & & \\ \hline Balance Sheet & & & & & \\ \hline Balance Sheet as of: & \begin{tabular}{l} Reclassified \\ Dec-31-2018 \end{tabular} & \begin{tabular}{l} Reclassified \\ Dec-31-2019 \end{tabular} & \begin{tabular}{l} Reclassified \\ Dec-31-2020 \end{tabular} & \begin{tabular}{l} Reclassified \\ Dec-31-2021 \end{tabular} & Dec-31-202 \\ \hline Currency & USD & USD & USD & USD & \\ \hline ASSETS & & & & & \\ \hline Cash And Equivalents & 7,111.0 & 8,437.0 & 10,894.0 & 9,577.0 & 14,741.0 \\ \hline Short Term Investments & 15,925.0 & 13,851.0 & 19,858.0 & 26,880.0 & 17,443.0 \\ \hline Total Cash \& ST Investments & 23,036.0 & 22,288.0 & 30,752.0 & 36,457.0 & 32,184.0 \\ \hline Accounts Receivable & 11,195.0 & 9,237.0 & 9,993.0 & 11,370.0 & 4,575.0 \\ \hline Total Receivables & 11,195.0 & 9,237.0 & 9,993.0 & 11,370.0 & 4,575.0 \\ \hline Inventory & 112200 & 107860 & 108080 & 120650 & 140800 \\ \hline \begin{tabular}{l} Inventory \\ Finance Div. Loans and Leases, ST \end{tabular} & \begin{tabular}{l} 11,220.0 \\ 54,353.0 \end{tabular} & \begin{tabular}{l} 10,786.0 \\ 53,651.0 \end{tabular} & \begin{tabular}{l} 10,808.0 \\ 42,401.0 \end{tabular} & \begin{tabular}{l} 12,065.0 \\ 32,543.0 \end{tabular} & \begin{tabular}{l} 14,080.0 \\ 49,874.0 \end{tabular} \\ \hline Finance Div. Other Curr. Assets & \begin{tabular}{l} 0,0,915.0 \\ 10,915.0 \end{tabular} & 12,614.0 & 19,390.0 & 13,261.0 & 13,139.0 \\ \hline Other Current Assets & 3,930.0 & 5,471.0 & 3,400.0 & 3,300.0 & 2,624.0 \\ \hline Total Current Assets & 114,649.0 & 114,047.0 & 116,744.0 & 108,996.0 & 116,476.0 \\ \hline Gross Property, Plant \& Equipment & 68,126.0 & 70,516.0 & 72,522.0 & 72,012.0 & 37,983.0 \\ \hline Accumulated Depreciation & (30,243.0) & (31,020.0) & (32,848.0) & (32,342.0) & \\ \hline Net Property, Plant \& Equipment & 37,883.0 & 39,496.0 & 39,674.0 & 39,670.0 & 37,983.0 \\ \hline & & & & & \\ \hline Long-term Investments & 2,959.0 & 3,719.0 & 6,601.0 & 5,445.0 & 2,678.0 \\ \hline Goodwill & 264.0 & 278.0 & 258.0 & 619.0 & \\ \hline Other Intangibles & 178.0 & 188.0 & 144.0 & 111.0 & \\ \hline Finance Div. Loans and Leases, LT & 55,544.0 & 53,703.0 & 55,277.0 & 51,256.0 & 49,903.0 \\ \hline Finance Div. Other LT Assets & 27,818.0 & 27,758.0 & 27,294.0 & 25,295.0 & 23,560.0 \\ \hline Deferred Tax Assets, LT & 10,412.0 & 11,863.0 & 12,423.0 & 13,796.0 & 15,394.0 \\ \hline Deferred Charges, LT & 247.0 & - & 283.0 & 309.0 & \\ \hline Other Long-Term Assets & 6,586.0 & 7,485.0 & 8,563.0 & 11,538.0 & 9,890.0 \\ \hline Total Assets & 256,540.0 & 258,537,0 & 267,261.0 & 257,035.0 & 255,884,0 \\ \hline & & & & & \\ \hline LIABILITIES & & & & & \\ \hline Accounts Payable & 21,520.0 & 20,673.0 & 22,204.0 & 22,349.0 & 24,507.0 \\ \hline Accrued Exp. & 3,286.0 & 3,502.0 & 3,499.0 & 3,109.0 & \\ \hline Short-term Borrowings & 614.0 & 315.0 & 613.0 & 286.0 & 359.0 \\ \hline Curr. Port. of LT Debt & 1,700.0 & 1,038.0 & 715.0 & 2,813.0 & 285.0 \\ \hline Curr. Port. of Leases & - & 459.0 & 369.0 & 421.0 & 490.0 \\ \hline Finance Div. Debt Current & 51,179.0 & 52,501.0 & 49,969.0 & 46,517.0 & 49,434.0 \\ \hline Finance Div. Other Curr. Liab. & - & 45.0 & - & - & 3,584.0 \\ \hline Unearned Revenue, Current & 2,095.0 & 2,091.0 & 2,161.0 & 2,349.0 & \\ \hline Other Current Liabilities & 15,175.0 & 17,508.0 & 17,662.0 & 12,883.0 & 18,207.0 \\ \hline Total Current Liabilities & 95,569.0 & 98,132.0 & 97,192.0 & 90,727.0 & 96,866.0 \\ \hline Long-Term Debt & 11,833.0 & 13,618.0 & 22,265.0 & 16,711.0 & 18,712.0 \\ \hline Long-Term Leases & 11,003.0 & \begin{tabular}{r} 1,132.0 \\ \end{tabular} & \begin{tabular}{r} 2,203.0 \\ 1,359.0 \end{tabular} & 1,537.0 & 1,589.0 \\ \hline Finance Div. Debt Non-Curr. & 88,887.0 & 87,658.0 & 87,708.0 & 71,200.0 & 69,605.0 \\ \hline Finance Div. Other Non-Curr. Liab. & - & - & - & - & 3,454.0 \\ \hline Unearned Revenue, Non-Current & 3,985.0 & 4,191.0 & 4,559.0 & 4,683.0 & \\ \hline Pension \& Other Post-Retire. Benefits & 15,723.0 & 16,722.0 & 18,048.0 & 15,373.0 & \\ \hline Def. Tax Liability, Non-Curr. & 597.0 & 490.0 & 538.0 & 1,581.0 & 628.0 \\ \hline Other Non-Current Liabilities & 3,880.0 & 3,364.0 & 4,781.0 & 6,601.0 & 21,863.0 \\ \hline Total Liabilities & 220,474.0 & 225,307.0 & 236,450.0 & 208,413.0 & 212,717.0 \\ \hline Common Stock & 41.0 & 41.0 & 41.0 & 410 & 420 \\ \hline Additional Paid In Capital & \begin{tabular}{r} 41.0 \\ 22,006.0 \end{tabular} & 22,165.0 & \begin{tabular}{r} 41.0 \\ 22,290.0 \end{tabular} & \begin{tabular}{r} 41.0 \\ 22,611.0 \end{tabular} & 22,832.0 \\ \hline Retained Earnings & 22,668.0 & 20,320.0 & 18,243.0 & 35,769.0 & 31,754.0 \\ \hline Treasury Stock & (1,417.0) & (1,613.0) & (1,590.0) & (1,563.0) & (2,047.0) \\ \hline Comprehensive Inc. and Other & (7,366.0) & (7,728.0) & (8,294.0) & (8,339.0) & (9,339.0) \\ \hline Total Common Equity & 35,932.0 & 33,185.0 & 30,690.0 & 48,519.0 & 43,242.0 \\ \hline Minority Interest & 134.0 & 45.0 & 121.0 & 103.0 & (75.0) \\ \hline & & & & & \\ \hline Total Equity & 36,066,0 & 33,230.0 & 30,811,0 & 48,622.0 & 43,167,0 \\ \hline & & & & & \\ \hline Total Liabilities And Equity & 256,540.0 & 258,537,0 & 267,261.0 & 257,035.0 & 255,884,0 \\ \hline Supplemental Items & & & & & \\ \hline Total Shares Out. on Balance Sheet Date & 4,071.0 & 3,964.9 & 3,978.7 & 4,004.2 & 3,986.2 \\ \hline & & & & & \\ \hline \end{tabular}Step by Step Solution
There are 3 Steps involved in it
Step: 1

Get Instant Access to Expert-Tailored Solutions
See step-by-step solutions with expert insights and AI powered tools for academic success
Step: 2

Step: 3
Ace Your Homework with AI
Get the answers you need in no time with our AI-driven, step-by-step assistance
Get Started
Fundamentals Of Financial Management
Authors: Richard Bulliet, Eugene F Brigham, Brigham/ Houston
11th Edition
1111795207, 9781111795207