QUESTION 5
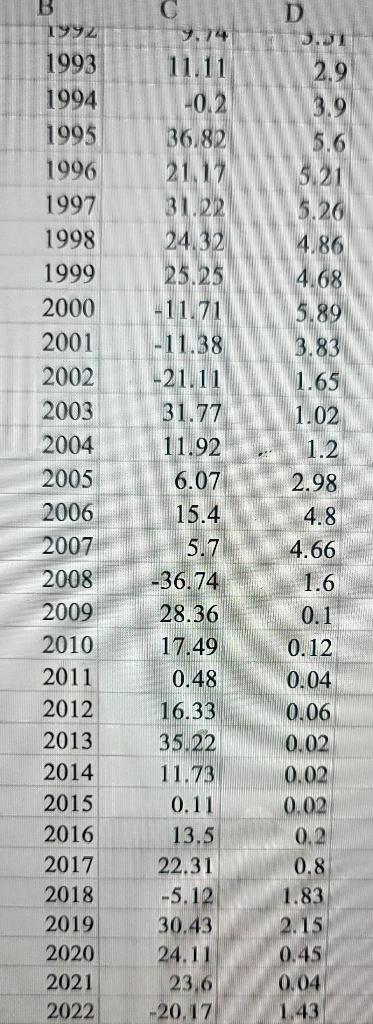
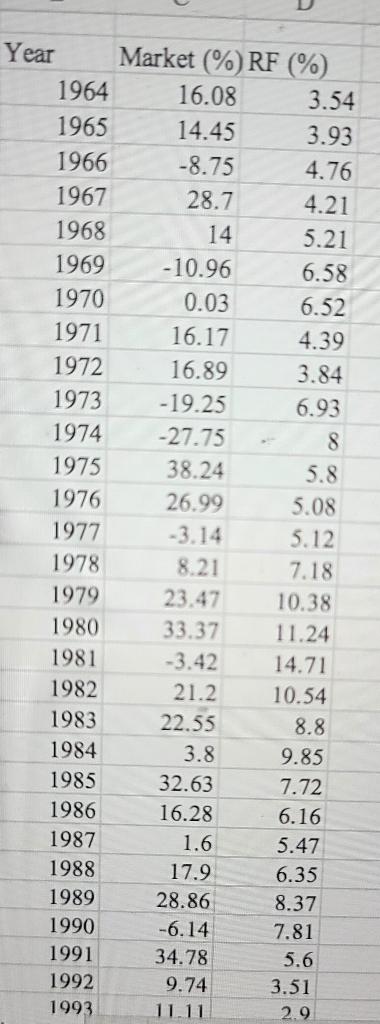
Based on the information in the Portfolio Analysis Problems Data 04 22 23A Excel file, what is the Sharpe ratio of the market?
| | | Less than 0.25 |
| | | Between 0.25 and 0.50 |
| | | Between 0.50 and 0.75 |
| | | Between 0.75 and 1.00 |
| | | More than 1.00 |
QUESTION 6
Based on the information in the Portfolio Analysis Problems Data 04 22 23A Excel file and the capital asset pricing model (CAPM), what is the average alpha for stock #1?
| | | Less than 1.5% |
| | | Between 1.5% and 3.5% |
| | | Between 3.5% and 5.5% |
| | | Between 5.5% and 7.5% |
| | | More than 7.5% |
QUESTION 7
Based on the information in the Portfolio Analysis Problems Data 04 22 23A Excel file and the capital asset pricing model (CAPM), what is the market beta for stock #1?
| | | Less than 0.50 |
| | | Between 0.50 and 0.75 |
| | | Between 0.75 and 1.25 |
| | | Between 1.25 and 1.50 |
| | | More than 1.50 |
QUESTION 8
Assume that all investments are priced based on the capital asset pricing model (CAPM) and there is currently no mispricing in the stock market. The current market risk premium is equal to the historical average premium and the risk free rate is equal to the risk free rate in year 60. Based on the information in the Portfolio Analysis Problems Data 04 22 23A Excel file and using the CAPM, what is the expected annual return for stock #1?
| | | Less than 5% |
| | | Between 5% and 10% |
| | | Between 10% and 15% |
| | | Between 15% and 20% |
| | | More than 25%  |
\begin{tabular}{|r|r|r|} \hline B 1992 & C & \multicolumn{1}{l}{ D } \\ \hline 1993 & 11.11 & 3.01 \\ \hline 1994 & -0.2 & 3.9 \\ \hline 1995 & 36.82 & 5.6 \\ 1996 & 21.17 & 5.21 \\ 1997 & 31.22 & 5.26 \\ \hline 1998 & 24.32 & 4.86 \\ \hline 1999 & 25.25 & 4.68 \\ \hline 2000 & -11.71 & 5.89 \\ \hline 2001 & -11.38 & 3.83 \\ \hline 2002 & -21.11 & 1.65 \\ \hline 2003 & 31.77 & 1.02 \\ \hline 2004 & 11.92 & 1.2 \\ \hline 2005 & 6.07 & 2.98 \\ \hline 2006 & 15.4 & 4.8 \\ \hline 2007 & 5.7 & 4.66 \\ \hline 2008 & -36.74 & 1.6 \\ \hline 2009 & 28.36 & 0.1 \\ \hline 2010 & 17.49 & 0.12 \\ \hline 2011 & 0.48 & 0.04 \\ \hline 2012 & 16.33 & 0.06 \\ \hline 2013 & 35.22 & 0.02 \\ \hline 2014 & 11.73 & 0.02 \\ \hline 2015 & 0.11 & 0.02 \\ \hline 2016 & 13.5 & 0.2 \\ \hline 2017 & 22.31 & 0.8 \\ \hline 2018 & -5.12 & 1.83 \\ \hline 2019 & 30.43 & 2.15 \\ \hline 2020 & 24.11 & 0.45 \\ \hline 2021 & 23.6 & 0.04 \\ \hline 2022 & -20.17 & 1.43 \\ \hline \end{tabular} \begin{tabular}{|r|r|r|} \hline Year & Market (\%) RF (\%) \\ \hline 1964 & 16.08 & 3.54 \\ \hline 1965 & 14.45 & 3.93 \\ \hline 1966 & -8.75 & 4.76 \\ \hline 1967 & 28.7 & 4.21 \\ \hline 1968 & 14 & 5.21 \\ \hline 1969 & -10.96 & 6.58 \\ \hline 1970 & 0.03 & 6.52 \\ \hline 1971 & 16.17 & 4.39 \\ \hline 1972 & 16.89 & 3.84 \\ \hline 1973 & -19.25 & 6.93 \\ \hline 1974 & -27.75 & -8 \\ \hline 1975 & 38.24 & 5.8 \\ \hline 1976 & 26.99 & 5.08 \\ \hline 1977 & -3.14 & 5.12 \\ \hline 1978 & 8.21 & 7.18 \\ \hline 1979 & 23.47 & 10.38 \\ \hline 1980 & 33.37 & 11.24 \\ \hline 1981 & -3.42 & 14.71 \\ \hline 1982 & 21.2 & 10.54 \\ \hline 1983 & 22.55 & 8.8 \\ \hline 1984 & 3.8 & 9.85 \\ \hline 1985 & 32.63 & 7.72 \\ \hline 1986 & 16.28 & 6.16 \\ \hline 1987 & 1.6 & 5.47 \\ \hline 1988 & 17.9 & 6.35 \\ \hline 1989 & 28.86 & 8.37 \\ \hline 1990 & -6.14 & 7.81 \\ \hline 1991 & 34.78 & 5.6 \\ \hline 1992 & 9.74 & 3.51 \\ \hline 1993 & 11.11 & 2.9 \\ \hline \end{tabular} \begin{tabular}{|r|r|r|} \hline B 1992 & C & \multicolumn{1}{l}{ D } \\ \hline 1993 & 11.11 & 3.01 \\ \hline 1994 & -0.2 & 3.9 \\ \hline 1995 & 36.82 & 5.6 \\ 1996 & 21.17 & 5.21 \\ 1997 & 31.22 & 5.26 \\ \hline 1998 & 24.32 & 4.86 \\ \hline 1999 & 25.25 & 4.68 \\ \hline 2000 & -11.71 & 5.89 \\ \hline 2001 & -11.38 & 3.83 \\ \hline 2002 & -21.11 & 1.65 \\ \hline 2003 & 31.77 & 1.02 \\ \hline 2004 & 11.92 & 1.2 \\ \hline 2005 & 6.07 & 2.98 \\ \hline 2006 & 15.4 & 4.8 \\ \hline 2007 & 5.7 & 4.66 \\ \hline 2008 & -36.74 & 1.6 \\ \hline 2009 & 28.36 & 0.1 \\ \hline 2010 & 17.49 & 0.12 \\ \hline 2011 & 0.48 & 0.04 \\ \hline 2012 & 16.33 & 0.06 \\ \hline 2013 & 35.22 & 0.02 \\ \hline 2014 & 11.73 & 0.02 \\ \hline 2015 & 0.11 & 0.02 \\ \hline 2016 & 13.5 & 0.2 \\ \hline 2017 & 22.31 & 0.8 \\ \hline 2018 & -5.12 & 1.83 \\ \hline 2019 & 30.43 & 2.15 \\ \hline 2020 & 24.11 & 0.45 \\ \hline 2021 & 23.6 & 0.04 \\ \hline 2022 & -20.17 & 1.43 \\ \hline \end{tabular} \begin{tabular}{|r|r|r|} \hline Year & Market (\%) RF (\%) \\ \hline 1964 & 16.08 & 3.54 \\ \hline 1965 & 14.45 & 3.93 \\ \hline 1966 & -8.75 & 4.76 \\ \hline 1967 & 28.7 & 4.21 \\ \hline 1968 & 14 & 5.21 \\ \hline 1969 & -10.96 & 6.58 \\ \hline 1970 & 0.03 & 6.52 \\ \hline 1971 & 16.17 & 4.39 \\ \hline 1972 & 16.89 & 3.84 \\ \hline 1973 & -19.25 & 6.93 \\ \hline 1974 & -27.75 & -8 \\ \hline 1975 & 38.24 & 5.8 \\ \hline 1976 & 26.99 & 5.08 \\ \hline 1977 & -3.14 & 5.12 \\ \hline 1978 & 8.21 & 7.18 \\ \hline 1979 & 23.47 & 10.38 \\ \hline 1980 & 33.37 & 11.24 \\ \hline 1981 & -3.42 & 14.71 \\ \hline 1982 & 21.2 & 10.54 \\ \hline 1983 & 22.55 & 8.8 \\ \hline 1984 & 3.8 & 9.85 \\ \hline 1985 & 32.63 & 7.72 \\ \hline 1986 & 16.28 & 6.16 \\ \hline 1987 & 1.6 & 5.47 \\ \hline 1988 & 17.9 & 6.35 \\ \hline 1989 & 28.86 & 8.37 \\ \hline 1990 & -6.14 & 7.81 \\ \hline 1991 & 34.78 & 5.6 \\ \hline 1992 & 9.74 & 3.51 \\ \hline 1993 & 11.11 & 2.9 \\ \hline \end{tabular}


