Answered step by step
Verified Expert Solution
Link Copied!

Question

1 Approved Answer

Question 5 In order to estimate the difference between the average yearly incomes of the marketing managers of British Columbia and Ontario, the following data
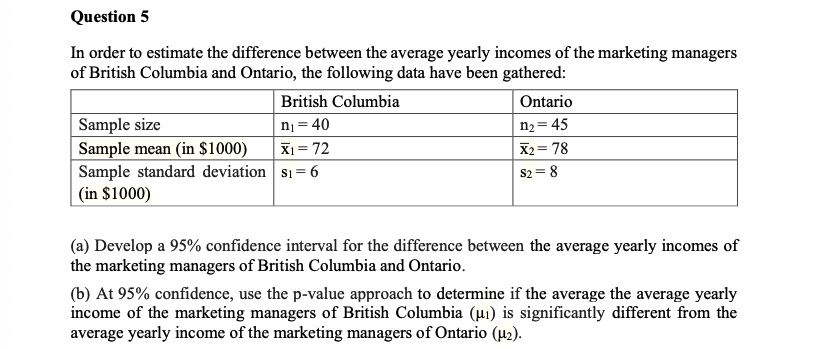
image text in transcribed
Question 5 In order to estimate the difference between the average yearly incomes of the marketing managers of British Columbia and Ontario, the following data have been gathered: British Columbia Ontario Sample size n1 = 40 n2 = 45 Sample mean (in $1000) X1 = 72 X2 = 78 Sample standard deviation $1 = 6 $2 = 8 (in $1000) (a) Develop a 95% confidence interval for the difference between the average yearly incomes of the marketing managers of British Columbia and Ontario. (b) At 95% confidence, use the p-value approach to determine if the average the average yearly income of the marketing managers of British Columbia (wi) is significantly different from the average yearly income of the marketing managers of Ontario (12)

Step by Step Solution

There are 3 Steps involved in it

Step: 1

blur-text-image

Get Instant Access to Expert-Tailored Solutions

See step-by-step solutions with expert insights and AI powered tools for academic success

Step: 2

blur-text-image

Step: 3

blur-text-image

Ace Your Homework with AI

Get the answers you need in no time with our AI-driven, step-by-step assistance

Get Started

Recommended Textbook for

Intro Stats

Authors: Richard D. De Veaux, Paul F. Velleman, David E. Bock

3rd edition

321533283, 321533289, 9780321463708, 9780321503848, 9780321503800, 9780321499431, 9780321499417, 978-0321500458

More Books

Students also viewed these Mathematics questions

Question

List out some inventory management techniques.

Answered: 1 week ago