

Answered step by step
Verified Expert Solution
Question
1 Approved Answer
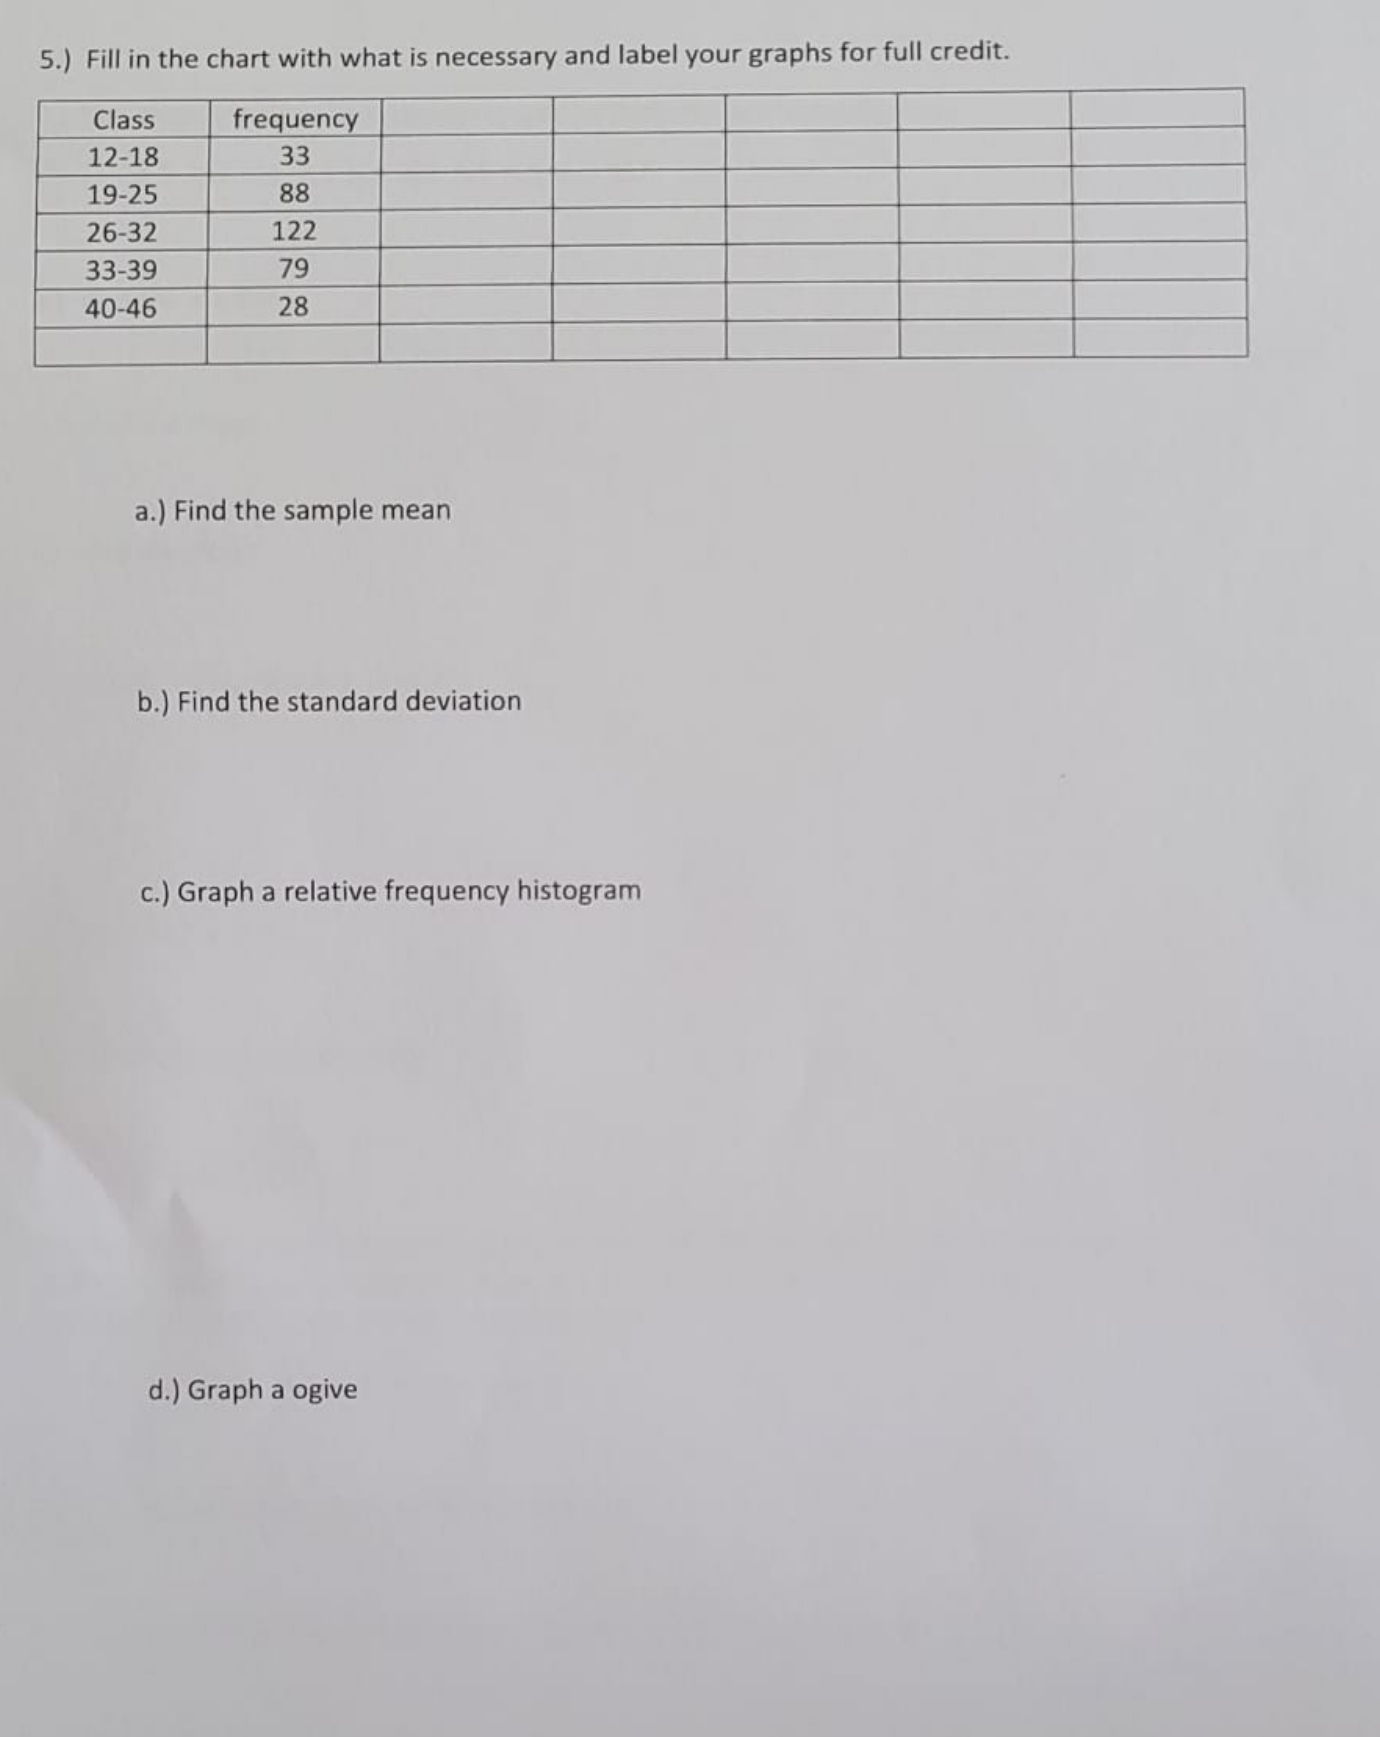
question 5 please 5.) Fill in the chart with what is necessary and label your graphs for full credit. Class frequency 12-18 33 19-25 88

question 5 please
Step by Step Solution
There are 3 Steps involved in it
Step: 1

Get Instant Access to Expert-Tailored Solutions
See step-by-step solutions with expert insights and AI powered tools for academic success
Step: 2

Step: 3
Ace Your Homework with AI
Get the answers you need in no time with our AI-driven, step-by-step assistance
Get Started
Performing Data Analysis Using IBM SPSS
Authors: Lawrence S Meyers, Glenn C Gamst, A J Guarino
1st Edition
1118363566, 9781118363560