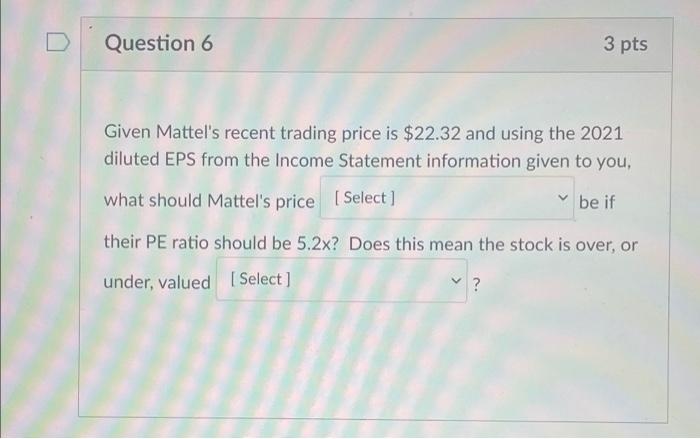
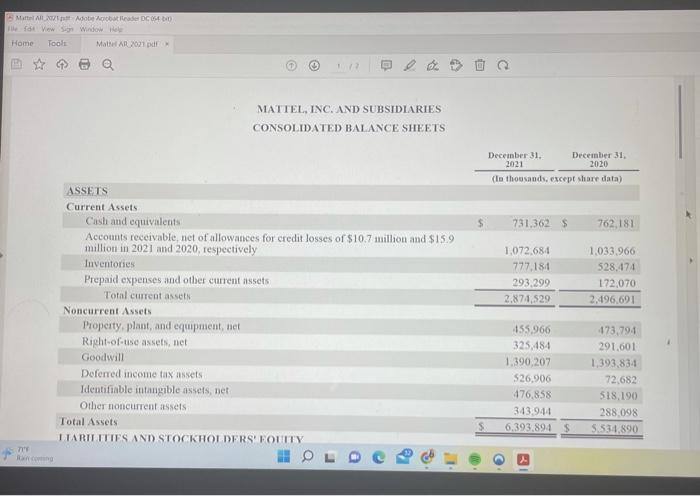
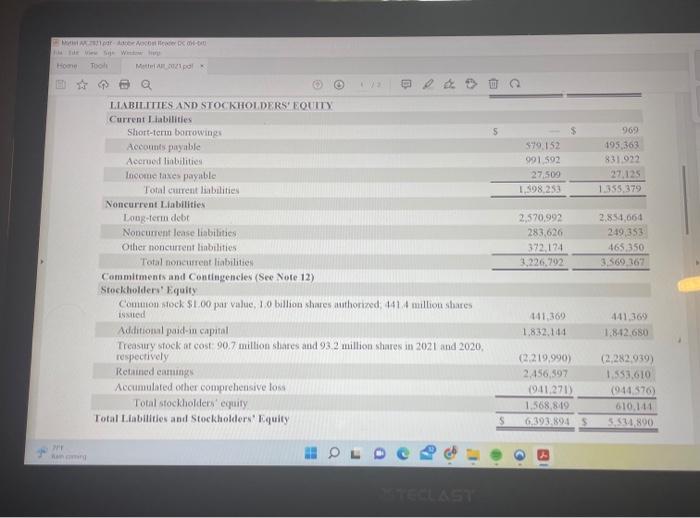
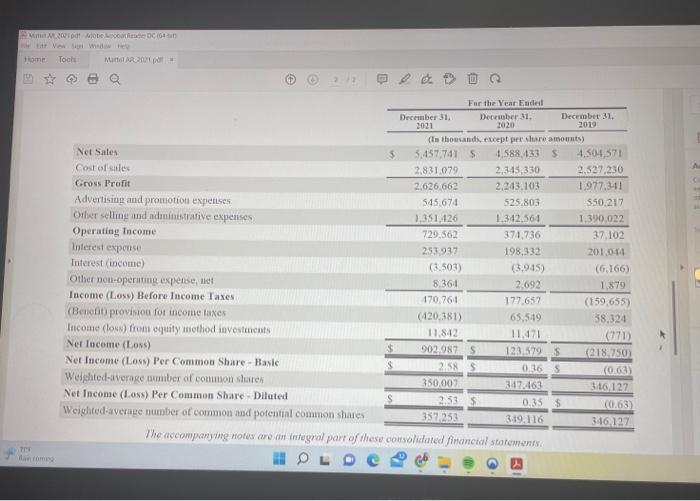
Question 6 3 pts Given Mattel's recent trading price is $22.32 and using the 2021 diluted EPS from the Income Statement information given to you, be if what should Mattel's price [Select] their PE ratio should be 5.2x? Does this mean the stock is over, or under, valued [Select] ? Mattel All 21pt Adobe Acrobat Reader DC 064 0 le fdt View Sign Window Help Home Tools Mattel AR 2021 pdf x 71'9 Raincoming ASSETS Current Assets Cash and equivalents Accounts receivable, net of allowances for credit losses of $10.7 million and $15.9 million in 2021 and 2020, respectively Inventories Prepaid expenses and other current assets Total current assets Noncurrent Assets MATTEL, INC. AND SUBSIDIARIES CONSOLIDATED BALANCE SHEETS Property, plant, and equipment, net Right-of-use assets, net Goodwill Deferred income tax assets i Identifiable intangible assets, net Other noncurrent assets i Total Assets LIABILITIES AND STOCKHOLDERS' EQUITY December 31, 2021 December 31, 2020 (In thousands, except share data) 731,362 $ 1,072,684 777,184 293,299 2.874,529 762,181 1,033,966 528,474 172,070 2,496,691 455,966 473,794 325,484 291,601 1,390,207 1,393,834 $26,906 72,682 476,858 518,190 343,944 288,098 6,393,894 $ 5,534,890 MA par Ace Aocon der D Home PHY un com Tools Mettel AR0/1 pd Q LIABILITIES AND STOCKHOLDERS' EQUITY Current Liabilities Short-term borrowings Accounts payable Accrued liabilities Income taxes payable Total current liabilities Noncurrent Liabilities i Long-term debt Noncurrent lease liabilities. Other noncurrent liabilities. Total noncurrent liabilities. Commitments and Contingencles (See Note 12) Stockholders' Equity Common stock $1.00 par value, 1.0 billion shares authorized, 441.4 million shares issued Additional paid-in capital Treasury stock at cost: 90.7 million shares and 93.2 million shares in 2021 and 2020, respectively Retained eamings Accumulated other comprehensive loss. Total stockholders' equity Total Liabilities and Stockholders' Equity $ 579,152 991,592 27,509 1,598,253 2.570,992 283,626 372,174 3,226,792 441,369 1,832,144 $ (2.219,990) 2,456,597 969 495,363 831,922 27,125 1.355,379 2,854,664 249,353 465.350 3,569,367 441,369 1.842,680 (2,282,939) 1,553,610 (941,271) (944,576) 1,568,849 610,144 6,393,894 $ 5,534,890 MA 2001 pa Ett View Sigi Home Tools my TEF an tomeg obete DC (64 Widow Help Matte AR 2021 p * Net Sales Cost of sales Gross Profit Advertising and promotion expenses Other selling and administrative expenses Operating Income Interest expense Interest (income) Other non-operating expense, net Income (Loss) Before Income Taxes (Benefit) provision for income taxes 2.12 Income (loss) from equity method investments Net Income (Loss) Net Income (Loss) Per Common Share-Basic Weighted-average number of common shares Net Income (Loss) Per Common Share-Diluted Weighted average number of common and potential common shares $ $ at December 31, 2021 (In thousands, 5,457,741 $ 2,831,079 2,626,662 545,674 1,351,426 729,562 253,937 (3.503) 8,364 470,764 (420,381) 11,842 For the Year Ended December 31. 2020 902.987 S 2.58 $ 350,007 2.53 $ 357,253 except per share amounts) 4,588,433 S 4,504,571 2,345,330 2,527,230 2.243.103 1,977,341 525.803 $50,217 1.342,564 1.390,022 374,736 198,332 (3,945) 2,692 177,657 65,549 11.471 123,579 S 0.36 S December 31, 2019 347,463 349,116 The accompanying notes are an integral part of these consolidated financial statements 0.35 $ 37,102 201,044 (6,166) 1,879 (159,655) 38,324 (771) (218.750) (0.63) 346,127 (0.63) 346,127
