

Answered step by step
Verified Expert Solution
Question
1 Approved Answer
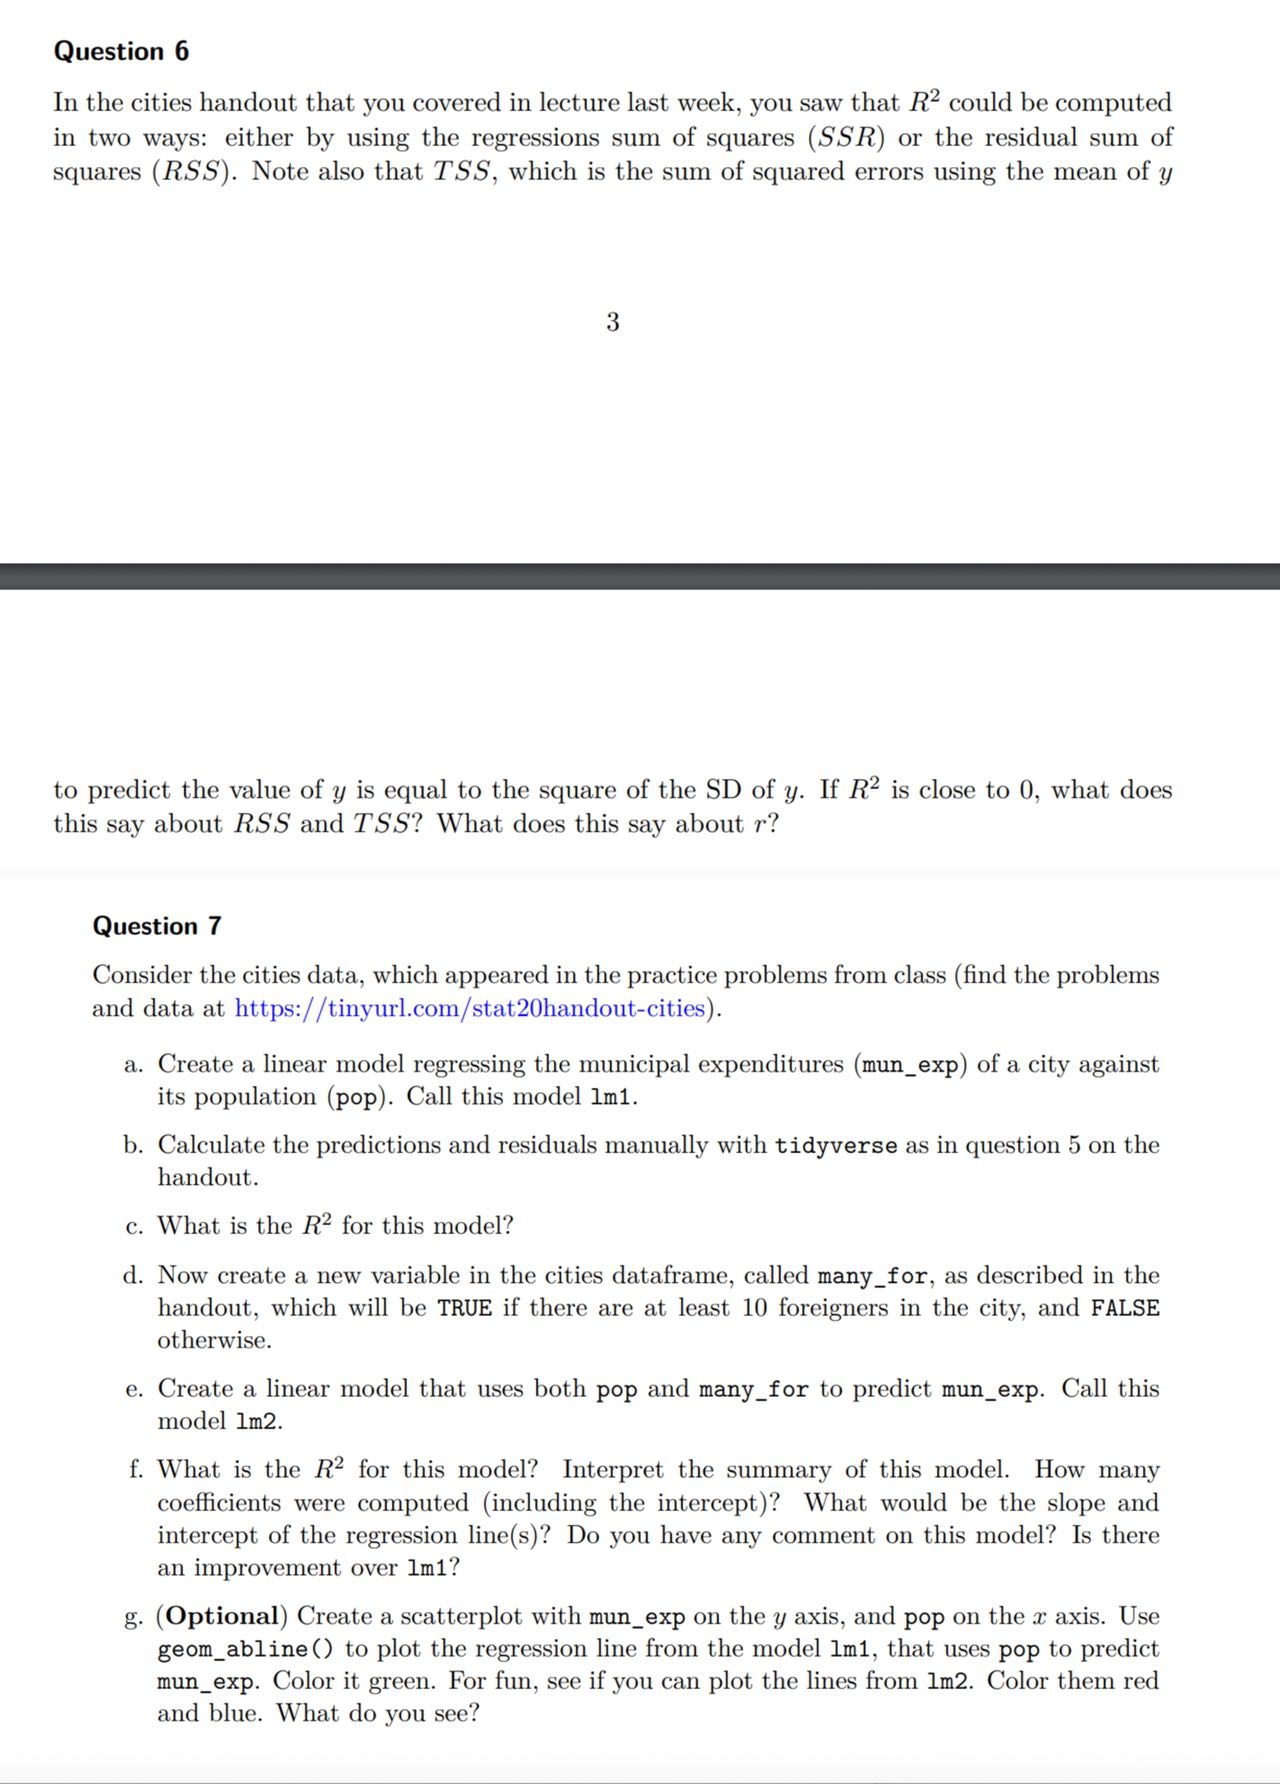
Question 6 In the cities handout that you covered in lecture last week, you saw that R2 could be computed in two ways: either by

Step by Step Solution
There are 3 Steps involved in it
Step: 1

Get Instant Access to Expert-Tailored Solutions
See step-by-step solutions with expert insights and AI powered tools for academic success
Step: 2

Step: 3
Ace Your Homework with AI
Get the answers you need in no time with our AI-driven, step-by-step assistance
Get Started
An Elementary Introduction To Mathematical Finance
Authors: Sheldon M Ross
3rd Edition
1139065106, 9781139065108