Answered step by step
Verified Expert Solution
Link Copied!

Question

1 Approved Answer

Question 6 (with R): Consider the boston_data. txt file on CANVAS. It gives variables for over 500 towns in the Boston area: MV Median value

image text in transcribed
Question 6 (with R): Consider the boston_data. txt file on CANVAS. It gives variables for over 500 towns in the Boston area: MV Median value of owner-occupied homes in 1000's of dollars INDUS proportion of non-retail business acres per town NOX nitric oxides concentration (parts per 10 million) RM average number of rooms per dwelling TAX full-value property-tax rate per 10,000 of dollars PTRATIO pupil-teacher ratio by town LSTAT % lower socioeconomic score Do the following items a) Compute the correlation matrix using R. b) Explain you conclusions in terms of the problem. c) Someone says that these correlations are due to random noise. Use confidence intervals to either refute this assertion or consider their point to be valid. d) Someone says these are just ecological correlations and do not mean anything. Refute this assertion

Step by Step Solution

There are 3 Steps involved in it

Step: 1

blur-text-image

Get Instant Access to Expert-Tailored Solutions

See step-by-step solutions with expert insights and AI powered tools for academic success

Step: 2

blur-text-image_2

Step: 3

blur-text-image_3

Ace Your Homework with AI

Get the answers you need in no time with our AI-driven, step-by-step assistance

Get Started

Recommended Textbook for

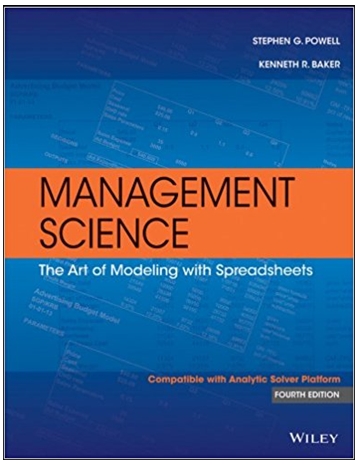
Management Science The Art Of Modeling With Spreadsheets

Authors: Stephen G. Powell, Kenneth R. Baker

4th Edition

978-1118517376, 9781118800348, 1118517377, 1118800346, 978-1118582695

More Books

Students also viewed these Mathematics questions

Question

What is the difference between work and play?

Answered: 1 week ago

Question

=+ Do you think it is a wise investment of the firm?

Answered: 1 week ago