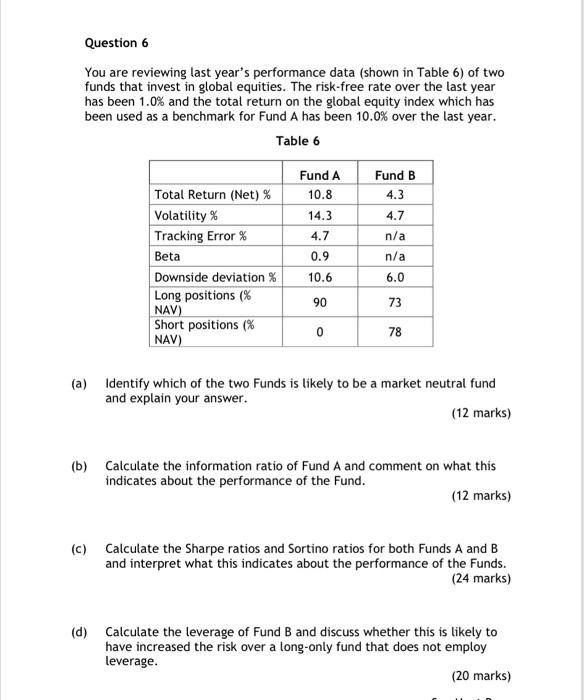
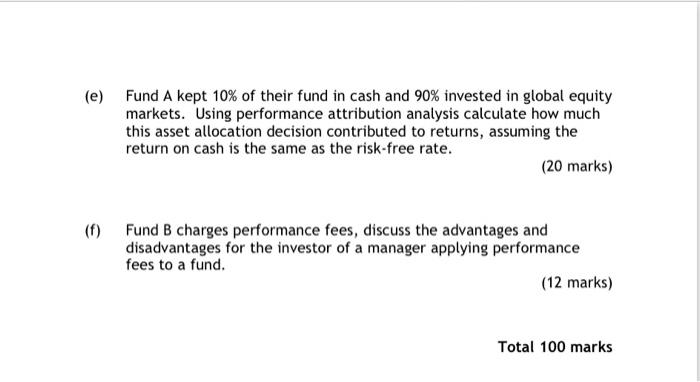
Question 6 You are reviewing last year's performance data (shown in Table 6) of two funds that invest in global equities. The risk-free rate over the last year has been 1.0% and the total return on the global equity index which has been used as a benchmark for Fund A has been 10.0% over the last year. Table 6 Fund A 10.8 Fund B 4.3 14.3 4.7 4.7 n/a Total Return (Net) % Volatility% Tracking Error % Beta Downside deviation % Long positions (% NAV) Short positions % NAV) 0.9 10.6 n/a 6.0 90 73 0 78 (a) Identify which of the two Funds is likely to be a market neutral fund and explain your answer. (12 marks) (b) Calculate the information ratio of Fund A and comment on what this indicates about the performance of the Fund. (12 marks) (c) Calculate the Sharpe ratios and Sortino ratios for both Funds A and B and interpret what this indicates about the performance of the Funds. (24 marks) (d) Calculate the leverage of Fund B and discuss whether this is likely to have increased the risk over a long-only fund that does not employ leverage. (20 marks) (e) Fund A kept 10% of their fund in cash and 90% invested in global equity markets. Using performance attribution analysis calculate how much this asset allocation decision contributed to returns, assuming the return on cash is the same as the risk-free rate. (20 marks) Fund B charges performance fees, discuss the advantages and disadvantages for the investor of a manager applying performance fees to a fund. (12 marks) Total 100 marks Question 6 You are reviewing last year's performance data (shown in Table 6) of two funds that invest in global equities. The risk-free rate over the last year has been 1.0% and the total return on the global equity index which has been used as a benchmark for Fund A has been 10.0% over the last year. Table 6 Fund A 10.8 Fund B 4.3 14.3 4.7 4.7 n/a Total Return (Net) % Volatility% Tracking Error % Beta Downside deviation % Long positions (% NAV) Short positions % NAV) 0.9 10.6 n/a 6.0 90 73 0 78 (a) Identify which of the two Funds is likely to be a market neutral fund and explain your answer. (12 marks) (b) Calculate the information ratio of Fund A and comment on what this indicates about the performance of the Fund. (12 marks) (c) Calculate the Sharpe ratios and Sortino ratios for both Funds A and B and interpret what this indicates about the performance of the Funds. (24 marks) (d) Calculate the leverage of Fund B and discuss whether this is likely to have increased the risk over a long-only fund that does not employ leverage. (20 marks) (e) Fund A kept 10% of their fund in cash and 90% invested in global equity markets. Using performance attribution analysis calculate how much this asset allocation decision contributed to returns, assuming the return on cash is the same as the risk-free rate. (20 marks) Fund B charges performance fees, discuss the advantages and disadvantages for the investor of a manager applying performance fees to a fund. (12 marks) Total 100 marks