

Question
Question 8 { 8 marks Still using the data in xwales.mwx, the equation of the regression line for the relationship between the percentage of M140
Question 8 { 8 marks
Still using the data in xwales.mwx, the equation of the regression line for
the relationship between the percentage of M140 students studying for a
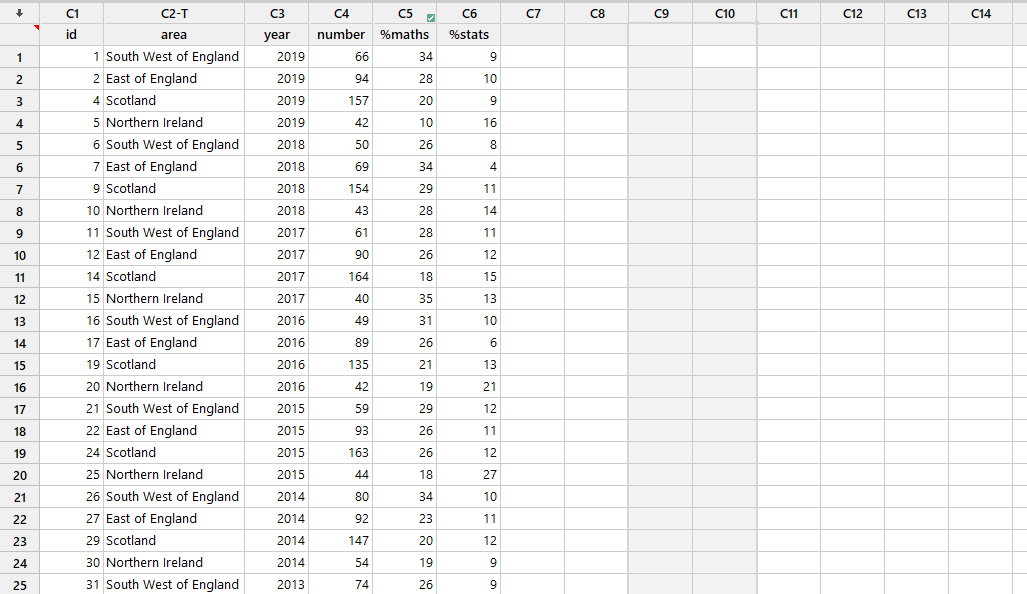
Maths and Stats degree and year is
y = 984:2 - 0:482x
where y is the percentage of M140 students studying for a Stats
degree and x is the year.
(a) Obtain and state the Pearson correlation coefficient for the relationship
between the percentage of students studying for a Maths and Stats
degree and the year. What does this tell you about the strength of the
linear relationship? [2]
(b) Produce a residual plot for the least squares regression line, and include
it in your answer. What does the residual plot indicate about the fit of
the least squares regression line? Justify your opinion. [3]
(c) Your manager has asked you to predict the percentage of students
studying for a Maths and Stats degree in 2020. Give one reason in
favour of using this regression line to predict the percentage for 2020
and give two reasons against
Step by Step Solution
There are 3 Steps involved in it
Step: 1

Get Instant Access to Expert-Tailored Solutions
See step-by-step solutions with expert insights and AI powered tools for academic success
Step: 2

Step: 3
Ace Your Homework with AI
Get the answers you need in no time with our AI-driven, step-by-step assistance
Get Started
Chaos, Noise And Fractals
Authors: E Roy Pike, L A Lugiato
1st Edition
1000112101, 9781000112108