Question
Question 9: Locate the average values of these ratios (from Q8) for the restaurant industry and comment on how well or poorly Franks All-American BarBeQue
Question 9: Locate the average values of these ratios (from Q8) for the restaurant industry and comment on how well or poorly Franks All-American BarBeQue appears to be doing with respect to the industry. This is a research question. Just as would a small business operator should do, you were to demonstrate your ability to research, either using the many sources provided to you in the textbook or to use the internet which provides an abundance of information that needs to be carefully looked at before relying totally on it. Regardless the information is there and is available at no monetary cost.
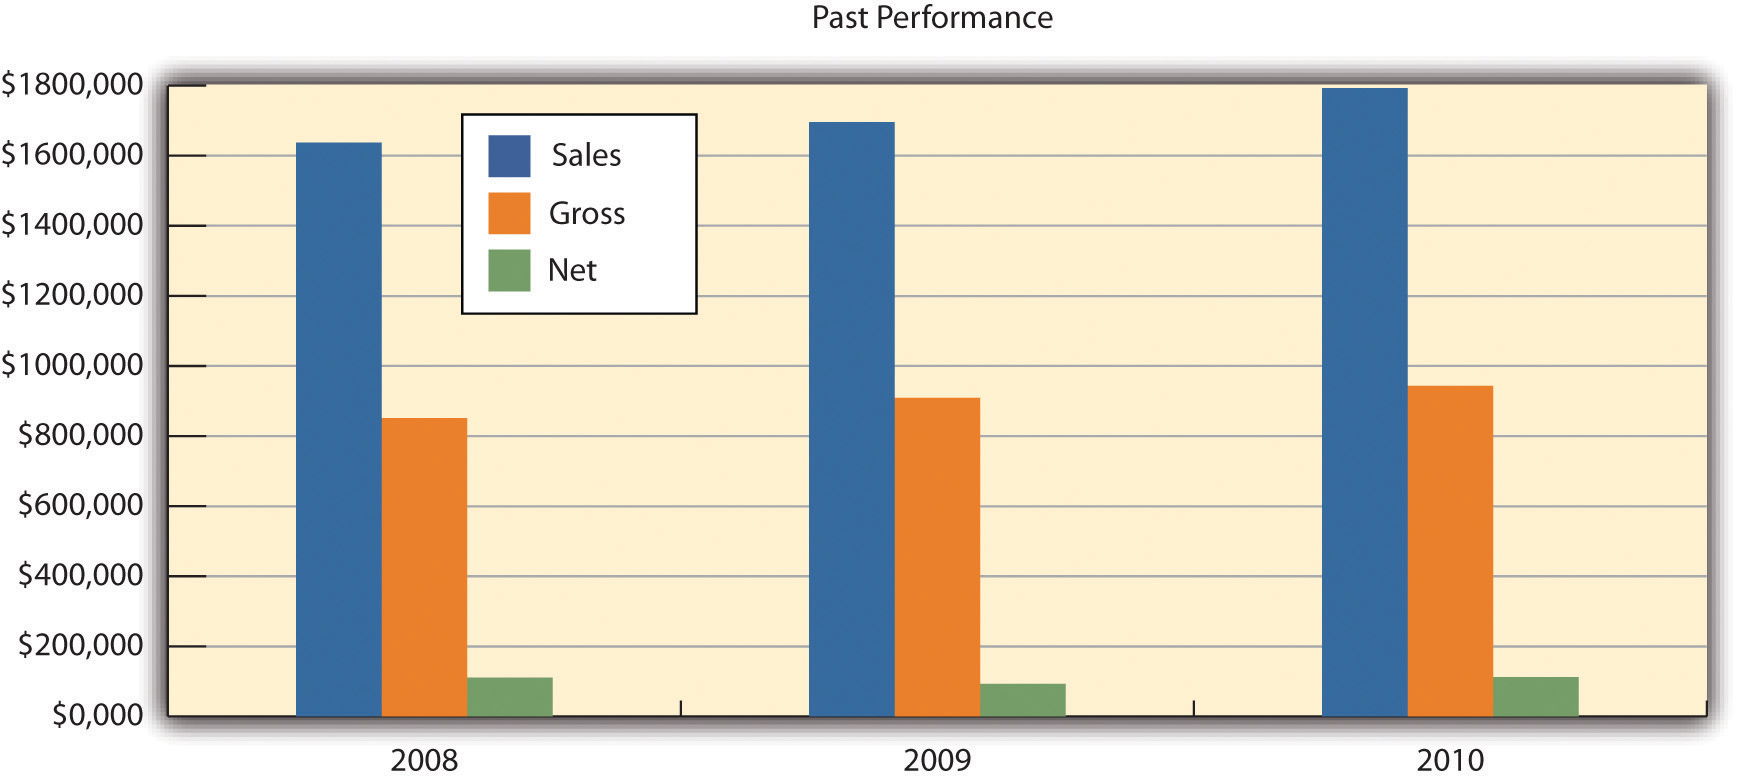
Table 16.1 "Past Performance of Franks All-American BarBeQue" provides a summary of key financial figures for the last three years2008 to 2010. Figure 16.1 "Past Performance Chart" illustrates these key numbers for that period of time.
Table 16.1 Past Performance of Franks All-American BarBeQue
| Past Performance | 2008 | 2009 | 2010 |
| Sales | $1,637,610 | $1,696,564 | $1,793,268 |
| Gross margin | $851,557 | $909,358 | $943,259 |
| Gross margin % | 52.00% | 53.60% | 52.60% |
| Operating expenses | $542,080 | $577,315 | $600,408 |
| Inventory turnover | 13.20 | 12.10 | 12.90 |
| Balance Sheet | 2008 | 2009 | 2010 |
| Current Assets | |||
| Cash | $102,665 | $125,172 | $102,665 |
| Inventory | $391,238 | $331,045 | $345,678 |
| Other current assets | $278,372 | $230,074 | $278,372 |
| Total current assets | $772,275 | $686,291 | $726,715 |
| Long-Term Assets | |||
| Long-term assets | $504,580 | $388,820 | $423,675 |
| Accumulated depreciation | $180,856 | $135,739 | $145,765 |
| Total long-term assets | $323,724 | $253,081 | $277,910 |
| Total assets | $1,095,999 | $939,372 | $1,004,625 |
| Current Liabilities | |||
| Accounts payable | $155,534 | $132,206 | $145,321 |
| Current borrowing | $170,000 | $150,000 | $135,000 |
| Other current liabilities (interest free) | $81,888 | $63,972 | $74,329 |
| Total current liabilities | $407,422 | $346,178 | $354,650 |
| Long-term liabilities | $220,000 | $190,000 | $175,000 |
| Total liabilities | $627,422 | $536,178 | $529,650 |
| Paid-in capital | $75,000 | $75,000 | $75,000 |
| Retained earnings | $281,838 | $234,377 | $287,114 |
| Earnings | $111,739 | $93,817 | $112,861 |
| Total capital | $468,577 | $403,194 | $474,975 |
| Total capital and liabilities | $1,095,999 | $939,372 | $1,004,625 |
| Other Inputs | |||
| Payment Days | 30 | 30 | 30 |
Figure 16.1 Past Performance Chart

Market Analysis Summary
Since the 1930s, the American public has spent at least 5 percent of its disposable income on eating out. Even with annual fluctuations, this is a strong indicator of the viability of this industry. This can be best illustrated by reviewing industry results for the last few years.
Both 2009 and 2010 were difficult years for the restaurant industry. In 2008, sales increased by 3.8 percent. However, sales fell by nearly 0.75 percent in 2009. This was the first year in the history of the industry that sales actually declined. The restaurant industrys sales in 2009 were $566 billion, down from over $570 billion. Prices rose by 2.2 percent in 2009. The increase in sales for 2010 was 0.5 percent, and price increases stabilized at 0.75 percent.
It is anticipated that there will be significant price competition in every segment of the restaurant industry. Some analysts argued that the poor performances for the restaurant industry in both 2009 and 2010 could be attributed to declines in both business and personal travel. Hotel occupancy rates in 2009 were down by nearly 10 percent. A study conducted by the National Restaurant Association argued that 20 percent of the sales in casual dining restaurants might be due to travelers and visitors. Franks All-American BarBeQue relies to a far lesser extent on travelers as customers. A rough estimate based on credit card receipts, for the period 20062010, indicated that travelers represented less than 2 percent of Franks sales. The pressure on the restaurant industry has been felt by many chain restaurants, which significantly curtailed their expansion plans.
Even though the recession was in full bloom in 2009, many food prices rose and rose significantly. Beef prices rose between 4 percent and 12 percent, while pork prices rose between 5 percent and 13 percent. Numerous studies have indicated that the increase in commodity prices will not be a transitory phenomenon.
With 925,000 food service locations in operation in the United States, this translates into 1 restaurant for every 330 Americans.
The health-care reform bill passed in 2010 should, in the near future, provide some relief for restaurants by creating a system that will assume greater responsibility by individuals to pay for their own health-care coverage.
Restaurants must also be much more cautious in the future about the possibility of hiring illegal aliens. As a whole, the National Restaurant Association supports immigration reform. However, it is concerned that any legislation should not limit a restaurants ability to hire workers. It is also concerned about the cost to assure worker eligibility.
The Mintel Group, a market research firm, found that consumers who are interested in quality opt for independent restaurants over chain outlets. An increasing consumer focus on health translates into an emphasis on natural ingredients. In the barbecue industry, this translates into naturally raised meats (i.e., the avoidance of artificial growth hormones in cattle), which are a hallmark of Franks All-American BarBeQue.
The National Restaurant Association estimated that sales in full-service restaurants in 2010 would exceed $184 billionan increase of 1.2 percent from 2009 sales.
Several macroeconomic factors make opening a restaurant in Darien attractive, including the following:
- Increases in the growth domestic product (GDP). The GDP is estimated to grow 1.7 percent in 2011 and 1.5 percent in 2012. The estimates for Fairfield County are significantly higher.
- Disposable personal income. The national level of personal income should rise nearly 4 percent in 2011, and there is an expectation of 3 percent growth in 2012. These numbers appear to be much stronger in the Fairfield County area.
Although 2010 was not a banner year for the restaurant industryit was one where more restaurants closed than opened each monththere was one bright spot: Chain barbecue restaurants grew between 2 percent and 3 percentan auspicious sign even for independent operators.
The home meal replacement market and the existing investment in restaurant equipment provide a nice growth opportunity for restaurants. It is been estimated that takeout sales in limited service chain restaurants might be as large as 60 percent of total sales. The same study found that takeout food has been growing twice as fast as the overall restaurant industry. Natural competitors in this market are supermarkets that offer prepackaged meals. However, we feel that fewif anysupermarkets provide the quality barbecue food that can be found at Franks.
Figure 16.2 "Market Analysis" illustrates the relative contributions.
Table 16.4 Market Analysis
| Potential Customers | Growth | 2011 | 2012 | 2013 | 2014 | 2015 |
| Lunch | 8% | 17,000 | 18,275 | 19,646 | 21,119 | 22,703 |
| Dinner | 5% | 40,000 | 42,000 | 44,100 | 46,305 | 48,620 |
| Takeout | 20% | 10,000 | 12,000 | 14,400 | 17,280 | 20,736 |
| Sauces | 15% | 12,000 | 13,800 | 15,870 | 18,251 | 20,989 |
| Total | 9.37% | 79,000 | 86,075 | 94,016 | 102,955 | 113,048 |
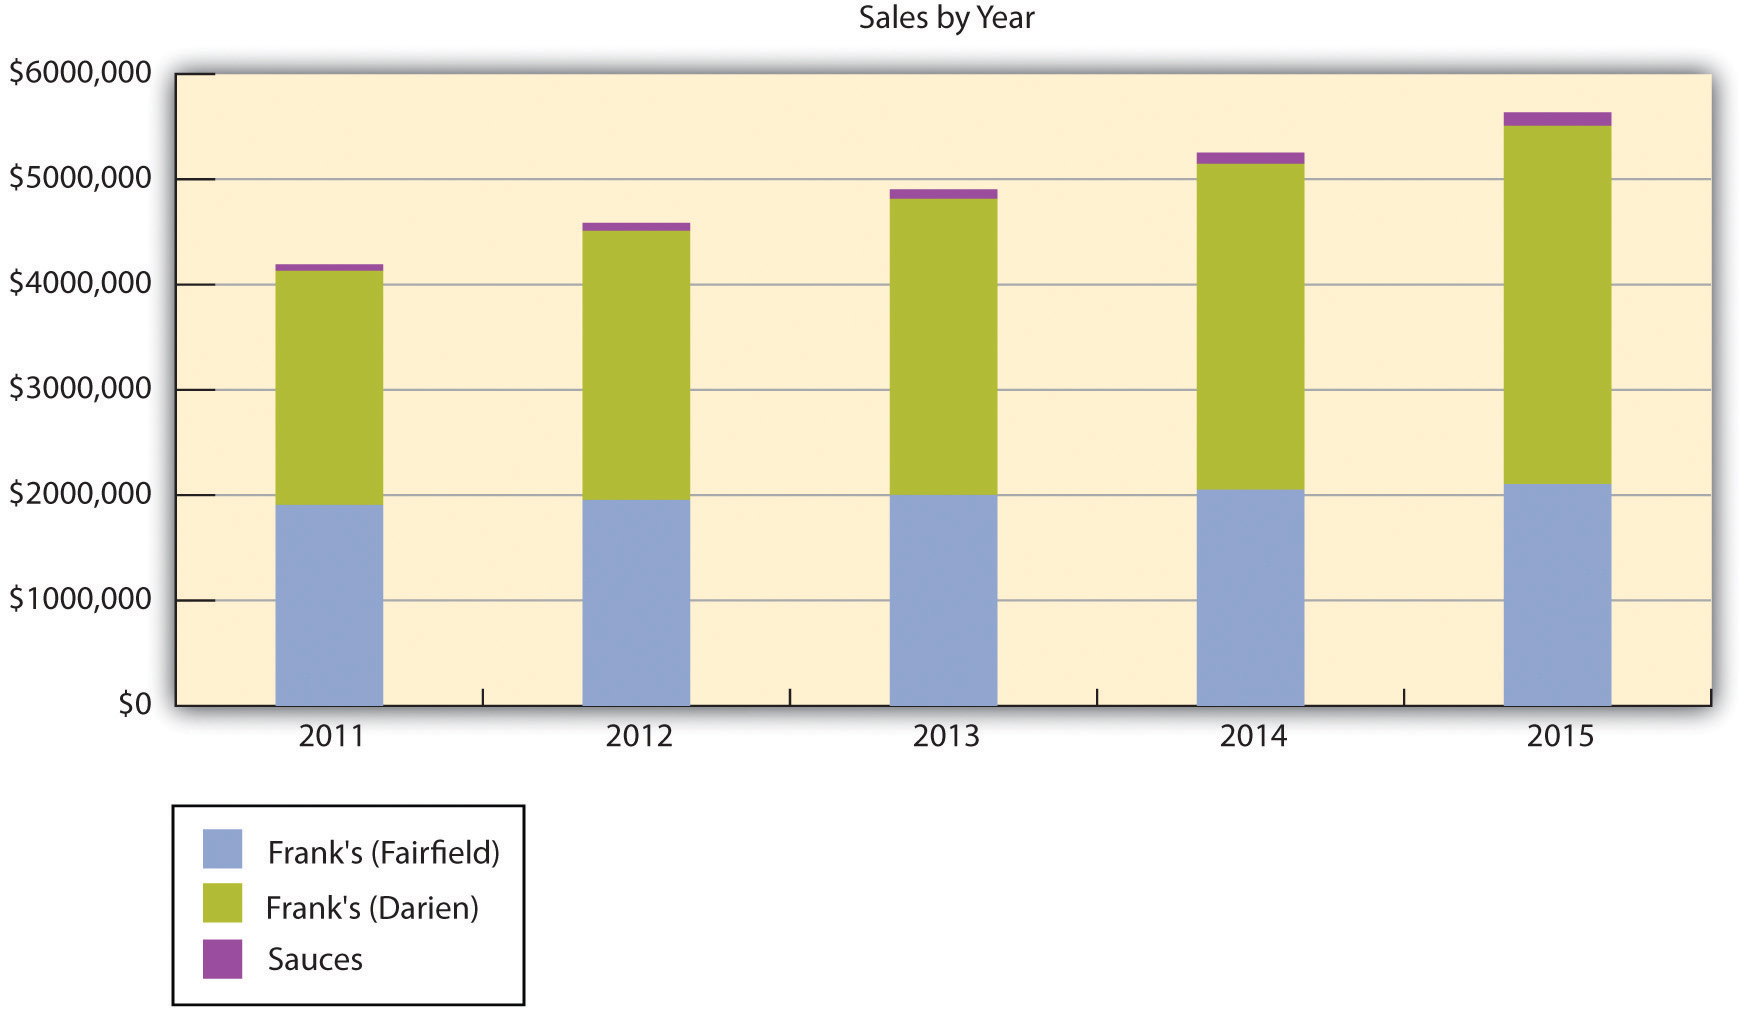
Figure 16.4 "Five-Year Forecast of Sales for Two Restaurants and Sauces" illustrates the breakdown of sales for the next five years.
Table 16.5 Sales Forecast
| Sales | 2011 | 2012 | 2013 | 2014 | 2015 |
| Franks (Fairfield) | $1,907,183 | $1,954,863 | $2,003,734 | $2,053,827 | $2,105,173 |
| Franks (Darien) | $2,222,000 | $2,555,300 | $2,810,830 | $3,091,913 | $3,401,104 |
| Sauces | $62,500 | $75,000 | $90,000 | $108,000 | $130,000 |
| Total sales | $4,191,683 | $4,585,163 | $4,904,564 | $5,253,740 | $5,636,277 |
| Direct Cost of Sales | 2011 | 2012 | 2013 | 2014 | 2015 |
| Franks (Fairfield) | $953,594 | $977,430 | $1,001,867 | $1,026,914 | $1,052,587 |
| Franks (Darien) | $1,111,000 | $1,277,650 | $1,405,415 | $1,545,957 | $1,700,552 |
| Sauces | $31,250 | $37,500 | $45,000 | $54,000 | $64,800 |
| Subtotal direct cost of sales | $2,095,844 | $2,292,580 | $2,452,282 | $2,626,871 | $2,817,939 |
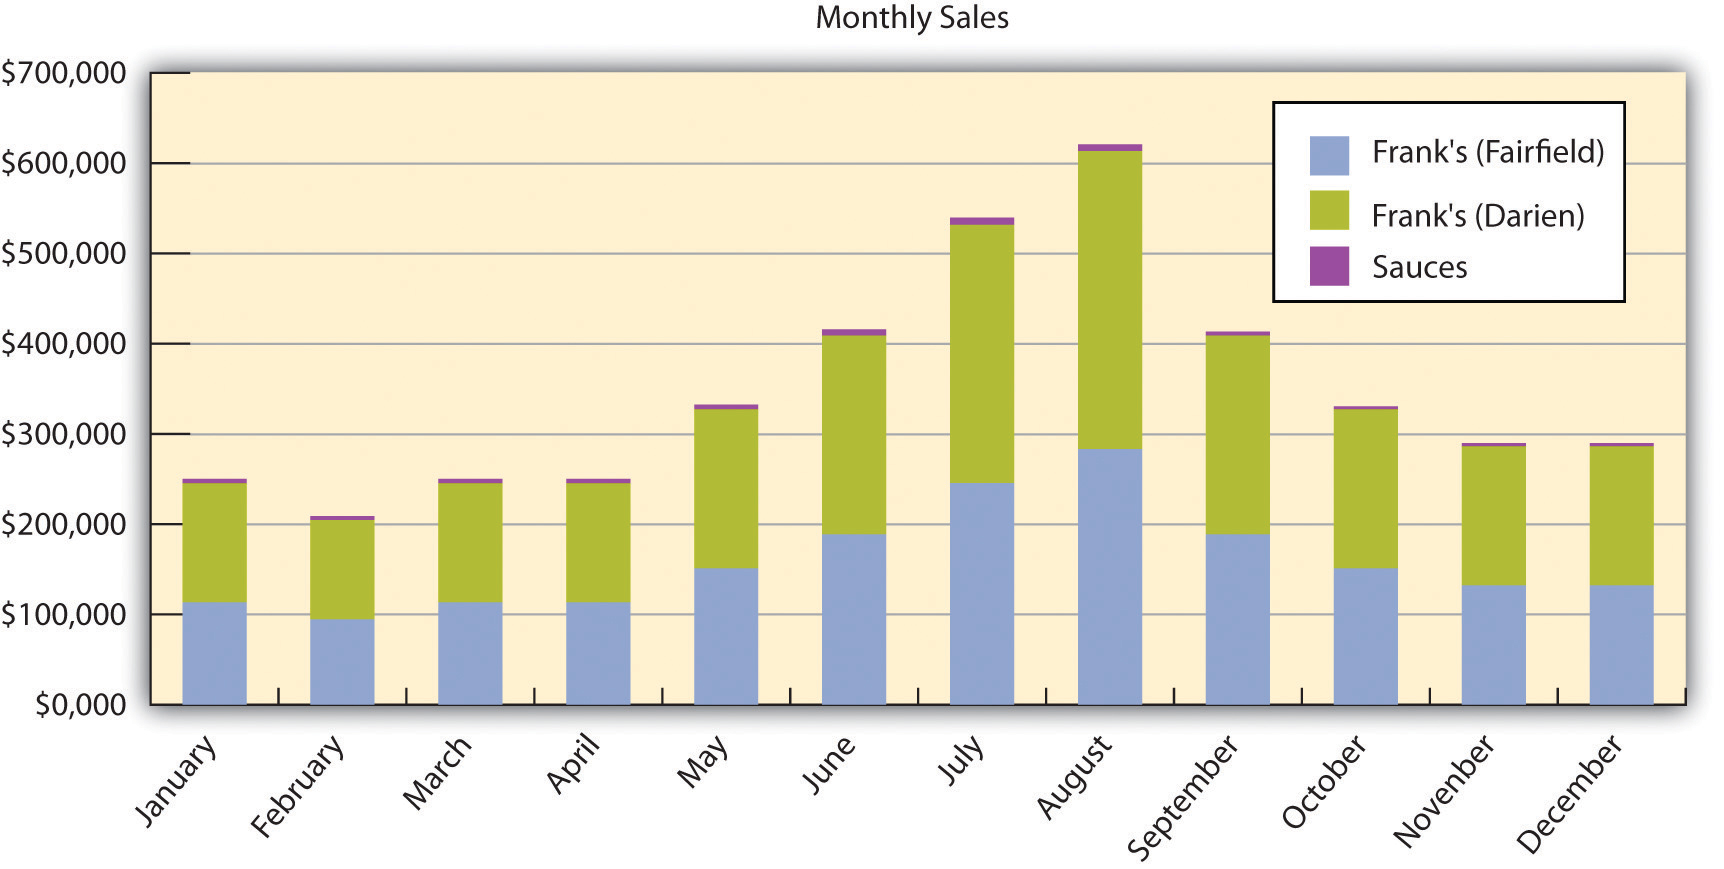
Figure 16.3 Monthly Sales for Two Restaurants and Sauces

Figure 16.4 Five-Year Forecast of Sales for Two Restaurants and Sauces

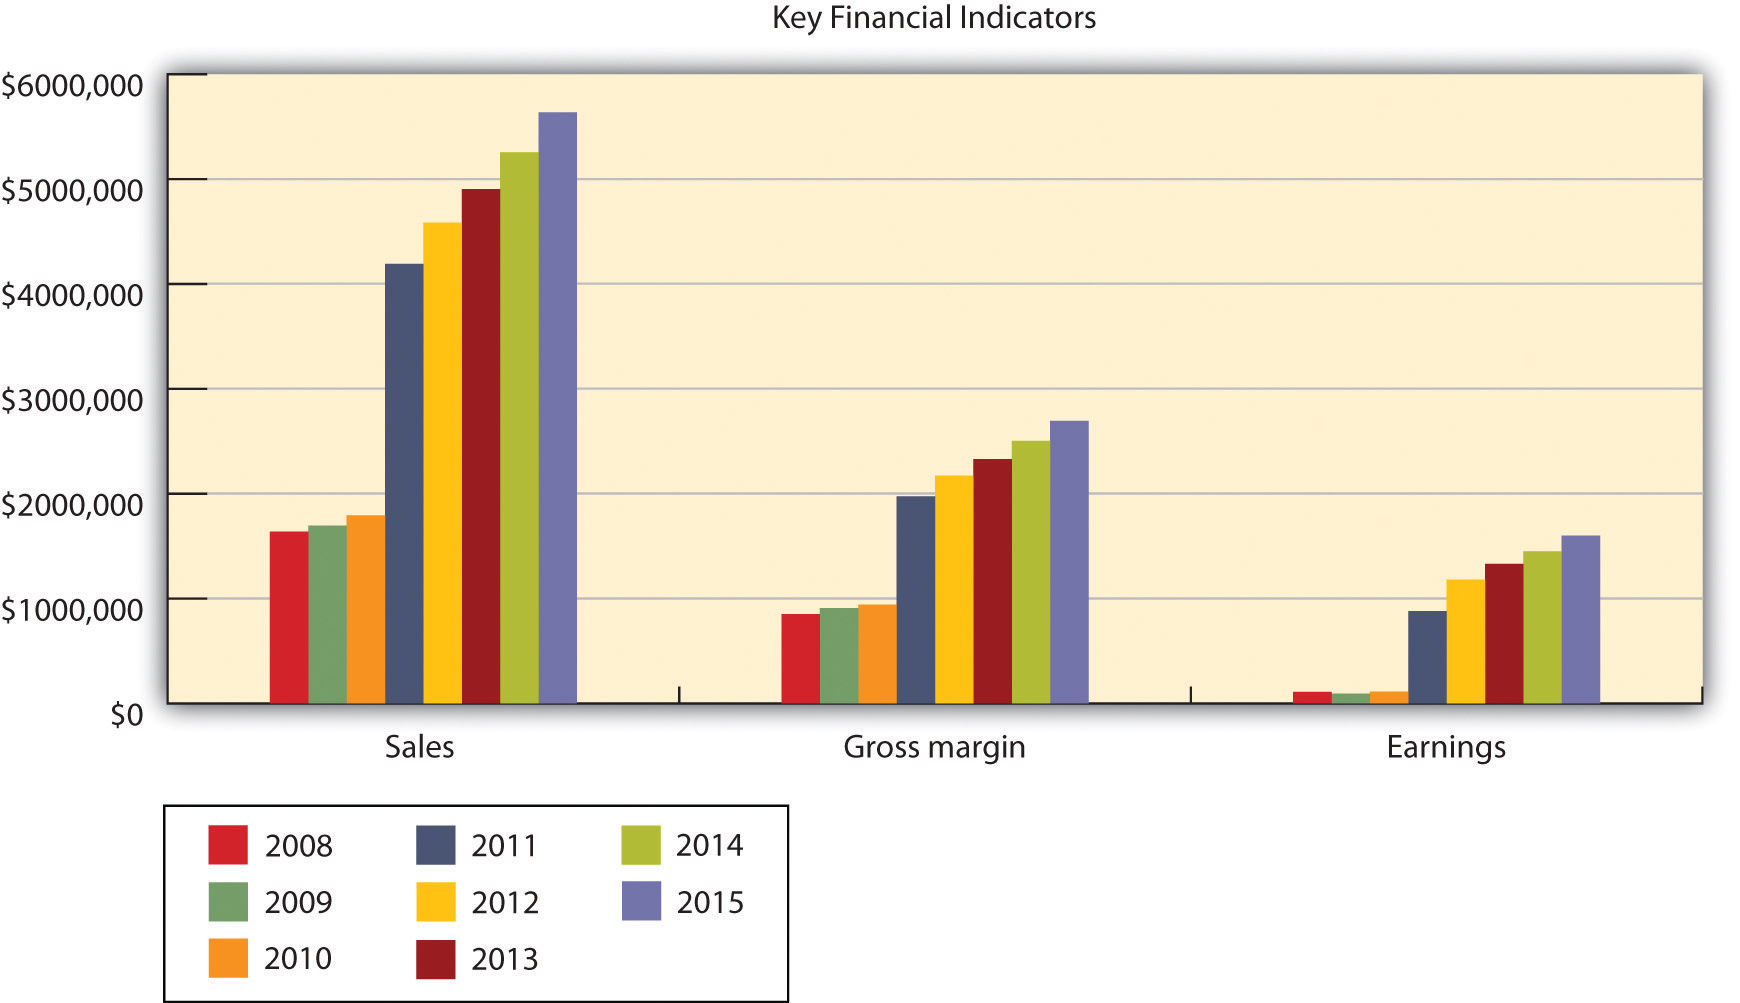
Key Financial Indicators
Figure 16.6 "Key Financial Indicators" provides historical (20082010) and forecasted (20112015) values for the key financial indicators.

Step by Step Solution
There are 3 Steps involved in it
Step: 1

Get Instant Access to Expert-Tailored Solutions
See step-by-step solutions with expert insights and AI powered tools for academic success
Step: 2

Step: 3

Ace Your Homework with AI
Get the answers you need in no time with our AI-driven, step-by-step assistance
Get Started


