Answered step by step
Verified Expert Solution
Question
1 Approved Answer
Question A statistics professor has a pond in his garden that contains frogs. Each day the professor likes to count how many frogs he can
Question
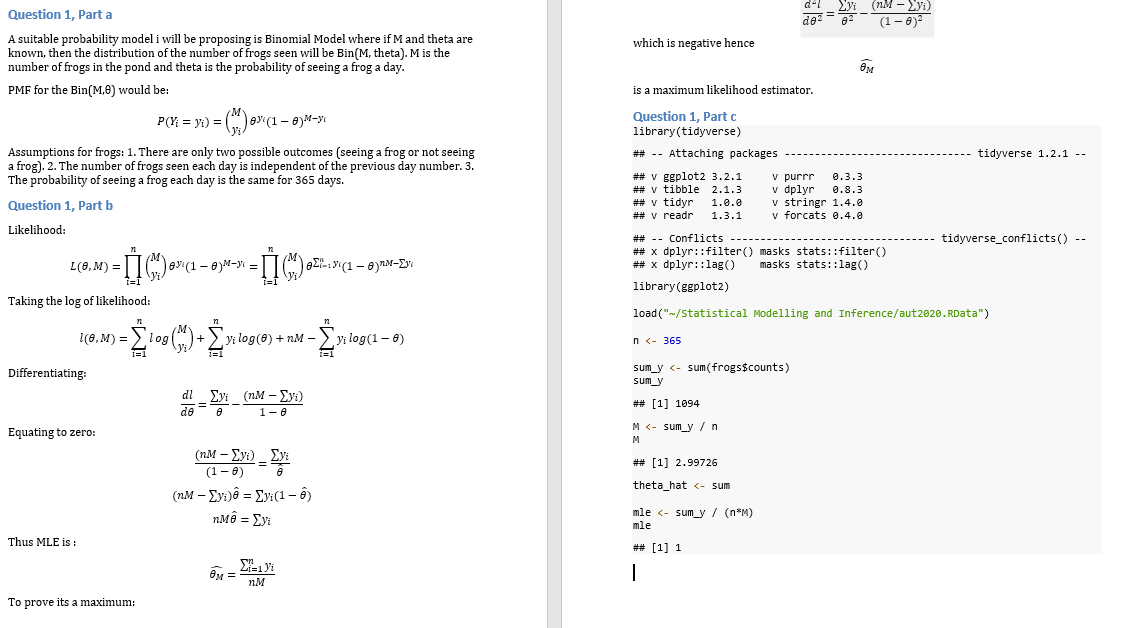
A statistics professor has a pond in his garden that contains frogs. Each day the professor likes to count how many frogs he can see there and has recorded the daily counts {y1, y2, . . . , yn} for a whole year (n = 365) in the data frame frogs.
Present a plot of the maximum likelihood values L( ??M, M) versus M for a suitable range of M values for the count data provided in frogs. Hence, estimate the total number of frogs living in the pond and the probability of appearance.
Data looks like this:


Step by Step Solution
There are 3 Steps involved in it
Step: 1

Get Instant Access to Expert-Tailored Solutions
See step-by-step solutions with expert insights and AI powered tools for academic success
Step: 2

Step: 3

Ace Your Homework with AI
Get the answers you need in no time with our AI-driven, step-by-step assistance
Get Started


