Answered step by step
Verified Expert Solution
Link Copied!

Question

1 Approved Answer

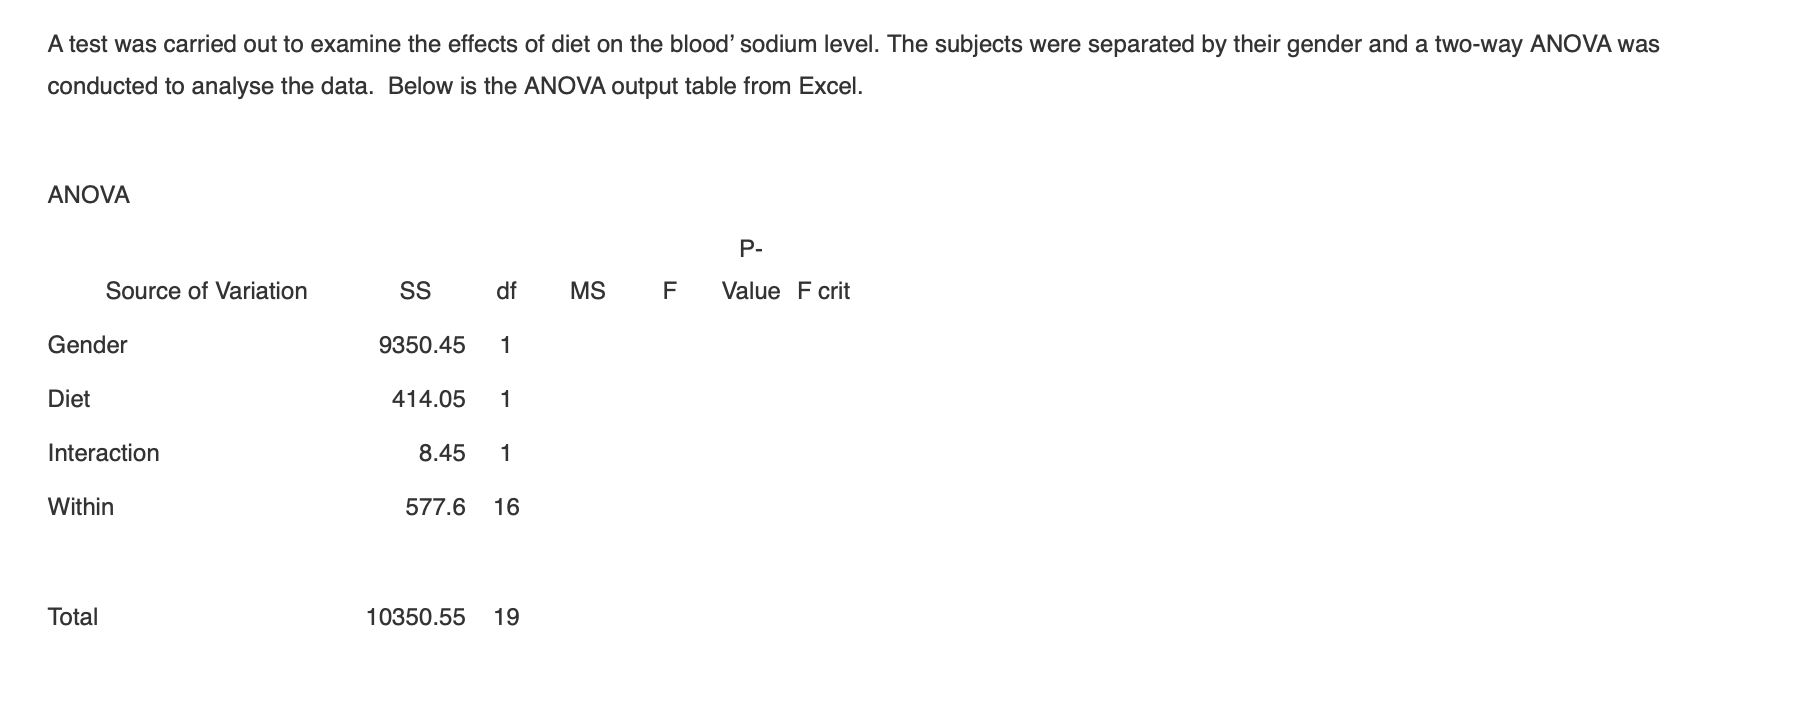
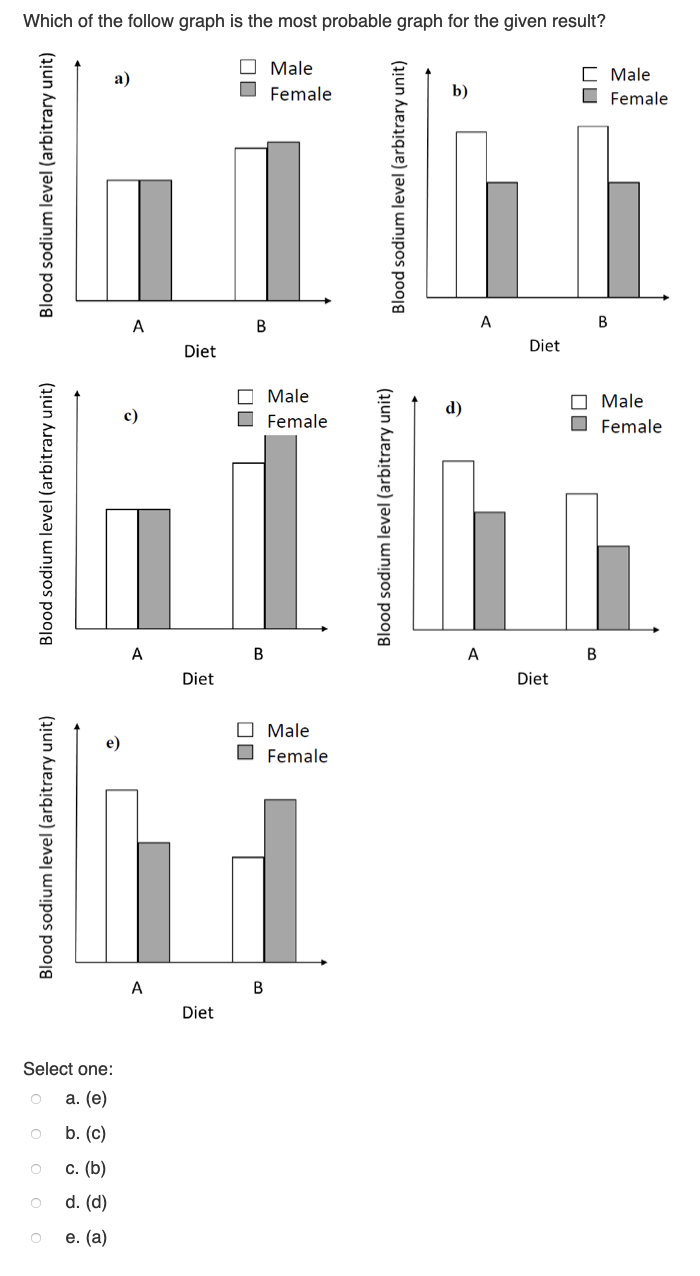
QUESTION: A test was carried out to examine the effects of diet on the blood' sodium level. The subjects were separated by their gender and

QUESTION:

image text in transcribedimage text in transcribed
A test was carried out to examine the effects of diet on the blood' sodium level. The subjects were separated by their gender and a two-way ANOVA was conducted to analyse the data. Below is the ANOVA output table from Excel. ANOVA P- Source of Variation SS df MS F Value F crit Gender 9350.45 Diet 414.05 Interaction 8.45 1 Within 577.6 16 Total 10350.55 19Which of the follow graph is the most probable graph for the given result? Blood sodium level (arbitrary unit) a) Male Female Blood sodium level (arbitrary unit) b) [ Male Female A B A B Diet Diet Blood sodium level (arbitrary unit) Male c) Male Female d) Female A B Blood sodium level (arbitrary unit) A B Diet Diet Blood sodium level (arbitrary unit) e) Male O Female A B Diet Select one: O a. (e) o b. (c) o c. (b) O d. (d) O e. (a)

Step by Step Solution

There are 3 Steps involved in it

Step: 1

blur-text-image

Get Instant Access to Expert-Tailored Solutions

See step-by-step solutions with expert insights and AI powered tools for academic success

Step: 2

blur-text-image

Step: 3

blur-text-image

Ace Your Homework with AI

Get the answers you need in no time with our AI-driven, step-by-step assistance

Get Started

Recommended Textbook for

Mathematics for Economics and Business

Authors: Ian Jacques

9th edition

129219166X, 9781292191706 , 978-1292191669

More Books

Students also viewed these Mathematics questions