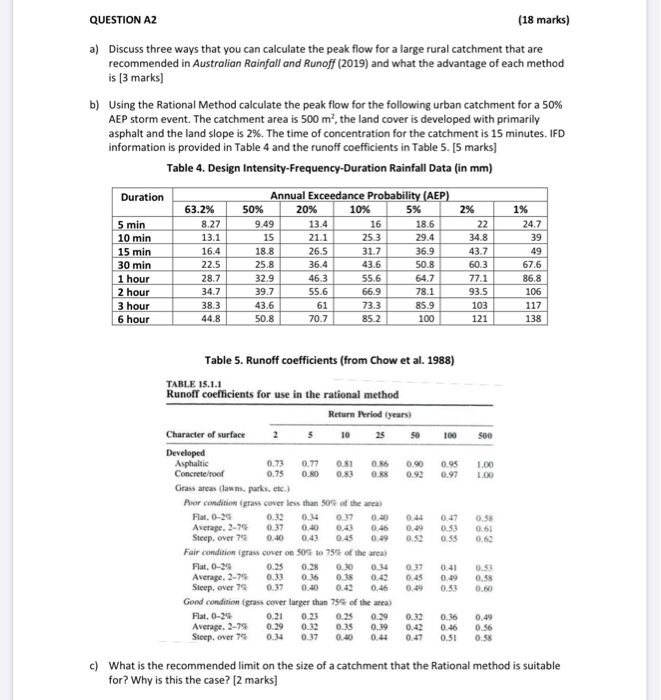
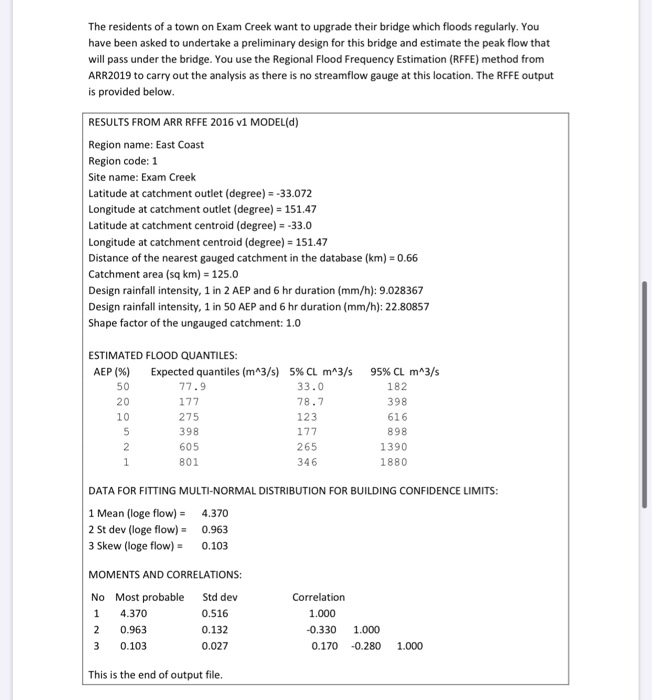
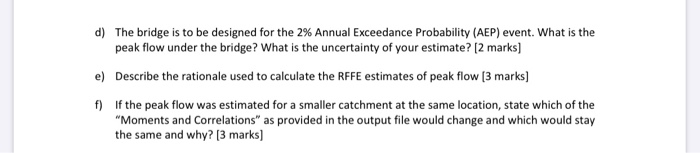
QUESTION A2 (18 marks) a) Discuss three ways that you can calculate the peak flow for a large rural catchment that are recommended in Australian Rainfall and Runoff (2019) and what the advantage of each method is [3 marks) b) Using the Rational Method calculate the peak flow for the following urban catchment for a 50% AEP storm event. The catchment area is 500 m, the land cover is developed with primarily asphalt and the land slope is 2%. The time of concentration for the catchment is 15 minutes. IFD information is provided in Table 4 and the runoff coefficients in Table 5. (5 marks] Table 4. Design Intensity-Frequency-Duration Rainfall Data (in mm) Duration 5 min 10 min 15 min 30 min 1 hour 2 hour 3 hour 6 hour 63.2% 8.27 13.1 16.4 22.5 28.7 Annual Exceedance Probability (AEP) 50% 20% 10% 1 5 % 2% 1% 9 .49 13.4 16 18.6 22 24.7 15 21. 1 25. 3 29.4 34.8 39 18.8 26.5 31. 7 36. 9 43.7 49 25.8 36.4 43.6 50.8 60.3 67.6 32. 946. 355. 664. 777. 186.8 39.7 55.6 66. 9 78 1 93.5 106 43. 6 61 73. 385. 9 103117 50. 8 70.7 85.2 100 121 138 383 44.8 Table 5. Runoff coefficients (from Chow et al. 1988) TABLE 15.1.1 Runoff coefficients for use in the rational method Return Period (years) Character of surface 2 5 10 25 50 100 500 Developed Asphaltic 0.73 0.77 0.81 0.86 0.90 0.95 1.00 Concrete roof 0.75 0. 0 0 0 0.92 0.97 1.00 Grass areas (lawns, parks, etc.) Poor condition grass cover less than 50% of the area) Flat 0- 2 0 .32 0.4 0.17 0.20 0.44 0.47 Average, 2-79 0 .37 0.40 0.43 0.16 0.19 0.53 0.61 Steep. over 75 0.40 0.43 0.45 0.19 0.520.550.63 Fair condition (grass cover on 50 to 75% of the area) Flat, 0-24 0.3 0. 2 0 0.4 037 0.41 0.53 Average 2.76 0.11 0.16 0.18 0.42 0.45 Steep. over 7 0 .37 0.40 0.4 0.6 0.19 0.53 0.60 Good condition (grass cover larger than 75% of the area) Flat, 0-24 0.21 0.23 0.23 0.29 0.32 0.36 0.49 Average, 2-79 0.19 0.32 0.39 0.19 0.42 Steep. over 75 0.34 0.37 0.40 0.44 0.47 0.51 0.58 0.49 0.55 c) What is the recommended limit on the size of a catchment that the Rational method is suitable for? Why is this the case? [2 marks] The residents of a town on Exam Creek want to upgrade their bridge which floods regularly. You have been asked to undertake a preliminary design for this bridge and estimate the peak flow that will pass under the bridge. You use the Regional Flood Frequency Estimation (RFFE) method from ARR2019 to carry out the analysis as there is no streamflow gauge at this location. The RFFE output is provided below. RESULTS FROM ARR RFFE 2016 v1 MODEL(d) Region name: East Coast Region code: 1 Site name: Exam Creek Latitude at catchment outlet (degree) = -33.072 Longitude at catchment outlet (degree) = 151.47 Latitude at catchment centroid (degree) = -33.0 Longitude at catchment centroid (degree) = 151.47 Distance of the nearest gauged catchment in the database (km) = 0.66 Catchment area (sq km) = 125.0 Design rainfall intensity, 1 in 2 AEP and 6 hr duration (mm/h): 9.028367 Design rainfall intensity, 1 in 50 AEP and 6 hr duration (mm/h): 22.80857 Shape factor of the ungauged catchment: 1.0 95% CL m^3/s 182 ESTIMATED FLOOD QUANTILES: AEP (%) Expected quantiles (m3/s) 5% CL m^3/s 77.9 33.0 177 78.7 275 123 398 177 605 265 801 346 398 616 898 1390 1880 DATA FOR FITTING MULTI-NORMAL DISTRIBUTION FOR BUILDING CONFIDENCE LIMITS: 1 Mean (loge flow) = 4.370 2 St dev (loge flow) = 0.963 3 Skew (loge flow) = 0.103 MOMENTS AND CORRELATIONS: No Most probable Std dev 1 4.370 0.516 2 0.963 0.132 30.103 0.027 Correlation 1.000 -0.330 0.170 1.000 -0.280 1.000 This is the end of output file. d) The bridge is to be designed for the 2% Annual Exceedance Probability (AEP) event. What is the peak flow under the bridge? What is the uncertainty of your estimate? (2 marks] e) Describe the rationale used to calculate the RFFE estimates of peak flow [3 marks] f) If the peak flow was estimated for a smaller catchment at the same location, state which of the "Moments and Correlations" as provided in the output file would change and which would stay the same and why? [3 marks) QUESTION A2 (18 marks) a) Discuss three ways that you can calculate the peak flow for a large rural catchment that are recommended in Australian Rainfall and Runoff (2019) and what the advantage of each method is [3 marks) b) Using the Rational Method calculate the peak flow for the following urban catchment for a 50% AEP storm event. The catchment area is 500 m, the land cover is developed with primarily asphalt and the land slope is 2%. The time of concentration for the catchment is 15 minutes. IFD information is provided in Table 4 and the runoff coefficients in Table 5. (5 marks] Table 4. Design Intensity-Frequency-Duration Rainfall Data (in mm) Duration 5 min 10 min 15 min 30 min 1 hour 2 hour 3 hour 6 hour 63.2% 8.27 13.1 16.4 22.5 28.7 Annual Exceedance Probability (AEP) 50% 20% 10% 1 5 % 2% 1% 9 .49 13.4 16 18.6 22 24.7 15 21. 1 25. 3 29.4 34.8 39 18.8 26.5 31. 7 36. 9 43.7 49 25.8 36.4 43.6 50.8 60.3 67.6 32. 946. 355. 664. 777. 186.8 39.7 55.6 66. 9 78 1 93.5 106 43. 6 61 73. 385. 9 103117 50. 8 70.7 85.2 100 121 138 383 44.8 Table 5. Runoff coefficients (from Chow et al. 1988) TABLE 15.1.1 Runoff coefficients for use in the rational method Return Period (years) Character of surface 2 5 10 25 50 100 500 Developed Asphaltic 0.73 0.77 0.81 0.86 0.90 0.95 1.00 Concrete roof 0.75 0. 0 0 0 0.92 0.97 1.00 Grass areas (lawns, parks, etc.) Poor condition grass cover less than 50% of the area) Flat 0- 2 0 .32 0.4 0.17 0.20 0.44 0.47 Average, 2-79 0 .37 0.40 0.43 0.16 0.19 0.53 0.61 Steep. over 75 0.40 0.43 0.45 0.19 0.520.550.63 Fair condition (grass cover on 50 to 75% of the area) Flat, 0-24 0.3 0. 2 0 0.4 037 0.41 0.53 Average 2.76 0.11 0.16 0.18 0.42 0.45 Steep. over 7 0 .37 0.40 0.4 0.6 0.19 0.53 0.60 Good condition (grass cover larger than 75% of the area) Flat, 0-24 0.21 0.23 0.23 0.29 0.32 0.36 0.49 Average, 2-79 0.19 0.32 0.39 0.19 0.42 Steep. over 75 0.34 0.37 0.40 0.44 0.47 0.51 0.58 0.49 0.55 c) What is the recommended limit on the size of a catchment that the Rational method is suitable for? Why is this the case? [2 marks] The residents of a town on Exam Creek want to upgrade their bridge which floods regularly. You have been asked to undertake a preliminary design for this bridge and estimate the peak flow that will pass under the bridge. You use the Regional Flood Frequency Estimation (RFFE) method from ARR2019 to carry out the analysis as there is no streamflow gauge at this location. The RFFE output is provided below. RESULTS FROM ARR RFFE 2016 v1 MODEL(d) Region name: East Coast Region code: 1 Site name: Exam Creek Latitude at catchment outlet (degree) = -33.072 Longitude at catchment outlet (degree) = 151.47 Latitude at catchment centroid (degree) = -33.0 Longitude at catchment centroid (degree) = 151.47 Distance of the nearest gauged catchment in the database (km) = 0.66 Catchment area (sq km) = 125.0 Design rainfall intensity, 1 in 2 AEP and 6 hr duration (mm/h): 9.028367 Design rainfall intensity, 1 in 50 AEP and 6 hr duration (mm/h): 22.80857 Shape factor of the ungauged catchment: 1.0 95% CL m^3/s 182 ESTIMATED FLOOD QUANTILES: AEP (%) Expected quantiles (m3/s) 5% CL m^3/s 77.9 33.0 177 78.7 275 123 398 177 605 265 801 346 398 616 898 1390 1880 DATA FOR FITTING MULTI-NORMAL DISTRIBUTION FOR BUILDING CONFIDENCE LIMITS: 1 Mean (loge flow) = 4.370 2 St dev (loge flow) = 0.963 3 Skew (loge flow) = 0.103 MOMENTS AND CORRELATIONS: No Most probable Std dev 1 4.370 0.516 2 0.963 0.132 30.103 0.027 Correlation 1.000 -0.330 0.170 1.000 -0.280 1.000 This is the end of output file. d) The bridge is to be designed for the 2% Annual Exceedance Probability (AEP) event. What is the peak flow under the bridge? What is the uncertainty of your estimate? (2 marks] e) Describe the rationale used to calculate the RFFE estimates of peak flow [3 marks] f) If the peak flow was estimated for a smaller catchment at the same location, state which of the "Moments and Correlations" as provided in the output file would change and which would stay the same and why? [3 marks)