

Question
Question: Any other important information: The companys earnings and profitability have deteriorated in recent years as the popularity of its products has begun to decline,
Question:
Any other important information:
The companys earnings and profitability have deteriorated in recent years as the popularity of its products has begun to decline, however, and the share price has fallen by roughly 60% since 2017.
The companys management team is trying to address these problems, and hopes that their new strategic plan will increase both the companys earnings and profitability in the future.
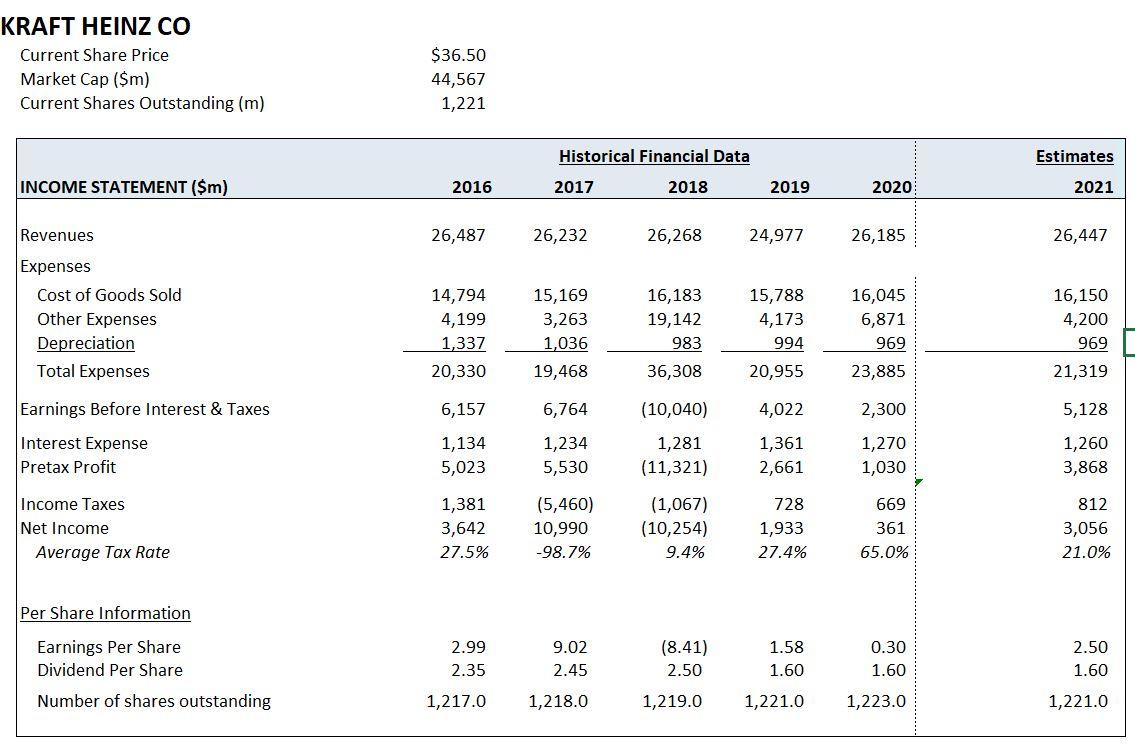
Investors remain skeptical, however, and are not currently predicting much of an improvement. Current estimates for 2021 are as follows:
- Expected Earnings Per Share (EPS) in 2021: $2.50
- Expected Return on Equity (ROE) in 2021: 6.0%
The companys dividend is expected to remain at $1.60 per share in 2021, although there is some hope that the company could increase this if earnings or profitability improve.
By contrast, one of the companys closest competitors Mondelez International (MDLZ) has maintained an ROE of 12%-13% for the last 5 years and has been growing its dividend by more than 10% per year by successfully growing its business.
It is clear that Kraft has the potential to improve its performance significantly if they can resolve the problems that have been holding them back.
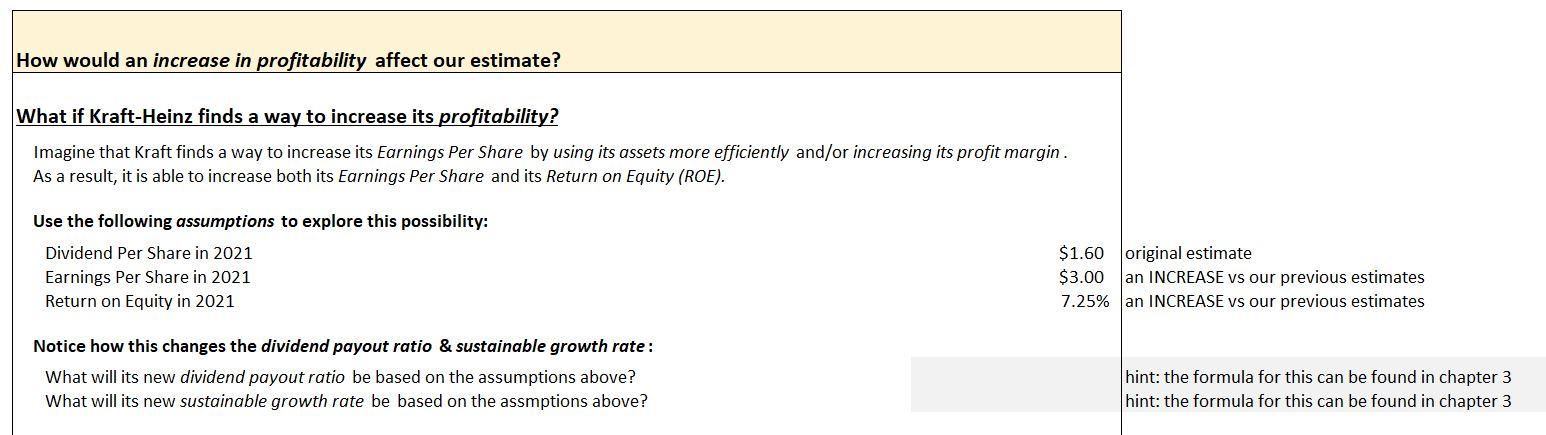
Question (notice how this changes the dividend payout ratio & sustainable growth rate):
| 1. What will its new dividend payout ratio be based on the assumptions above? | ||||
| 2. What will its new sustainable growth rate be based on the assmptions above? | ||||
Both formulas.
KRAFT HEINZ CO Current Share Price Market Cap ($m) Current Shares Outstanding (m) $36.50 44,567 1,221 Historical Financial Data Estimates INCOME STATEMENT ($m) 2016 2017 2018 2019 2020 2021 Revenues 26,487 26,232 26,268 24,977 26,185 26,447 Expenses Cost of Goods Sold Other Expenses Depreciation Total Expenses 14,794 4,199 1,337 20,330 15,169 3,263 1,036 19,468 16,183 19,142 983 15,788 4,173 994 16,045 6,871 969 23,885 16,150 4,200 969 36,308 20,955 21,319 Earnings Before Interest & Taxes 6,157 6,764 (10,040) 4,022 2,300 5,128 1,281 Interest Expense Pretax Profit 1,134 5,023 1,234 5,530 (11,321) 1,361 2,661 1,270 1,030 1,260 3,868 Income Taxes Net Income Average Tax Rate 1,381 3,642 27.5% (5,460) 10,990 -98.7% (1,067) (10,254) 9.4% 728 1,933 27.4% 669 361 65.0% 812 3,056 21.0% Per Share Information Earnings Per Share Dividend Per Share Number of shares outstanding 2.99 2.35 9.02 2.45 (8.41) 2.50 1.58 1.60 0.30 1.60 2.50 1.60 1,217.0 1,218.0 1,219.0 1,221.0 1,223.0 1,221.0 Historical Financial Data Estimates BALANCE SHEET($m) 2016 2017 2018 2019 2020 2021 ASSETS Current Assets Cash Receivables Inventories Other Current Assets Total Current Assets 4,204 898 2,684 967 8,753 1,769 1,856 2,815 826 7,266 1,163 2,281 2,667 2,964 9,075 2,280 2,146 2,721 950 8,097 3,417 2,063 2,554 2,788 10,822 3,500 2,800 2,580 2,816 11,695 Fixed Assets Net Fixed Assets 111,727 112,966 94,386 93,353 89,008 88,750 Total Assets 120,480 120,232 103,461 101,450 99,830 100,445 LIABILITIES & OWNER'S EQUITY 4,347 Current Liabilities Accounts Payable Notes Payable Other Current Liabilities Total Current Liabilities 375 3,996 2,691 2,814 9,501 4,449 3,203 2,480 10,132 4,153 398 2,952 7,503 4,003 1,175 2,697 7,875 4,304 371 3,386 8,061 3,420 8,142 Long-Term Debt Other Liabilities 29,713 23,692 28,333 15,526 30,770 13,413 28,670 13,156 28,545 12,981 28,400 12,981 Total Liabilties 62,906 53,991 51,686 49,701 49,587 49,523 Owner's Equity Common Stock & Paid-In Surplus Retained Earnings Owner's Equity 58,614 (1,040) 57,574 58,706 7,535 66,241 58,571 (6,796) 51,775 56,695 (4,946) 51,749 54,904 (4,661) 50,243 54,483 (3,560) 50,923 Total Liabilities & Owner's Equity 120,480 120,232 103,461 101,450 99,830 100,445 For Reference: Net Working Capital (748) (2,866) 1,572 222 2,761 3,554 Historical Financial Data Estimates Ratio Analysis: 2016 2017 2018 2019 2020 2021 Profitability Ratios: ROA ROE 3.0% 6.3% 9.1% 16.6% -9.9% -19.8% 1.9% 3.7% 0.4% 0.7% 3.0% 6.0% Components of DuPont Formula Net Profit Margin Total Asset Turnover Equity Multiplier 13.8% 22.0% 2.1 41.9% 21.8% 1.8 -39.0% 25.4% 2.0 7.7% 24.6% 1.4% 26.2% 2.0 11.6% 26.3% 2.0 2.0 Liquidity Ratios Current Ratio Quick Ratio Cash Ratio 0.92 0.64 0.72 0.44 0.17 1.21 0.85 0.16 1.03 0.68 0.29 1.34 1.03 0.42 1.44 1.12 0.44 0.43 Solvency Ratios Times Interest Earned Ratio Total Debt Ratio 5.4 52% 5.5 45% (7.8) 50% 3.0 49% 1.8 50% 4.1 49% Dividend Payout Dividend Payout Ratio 79% 27% -30% 101% 542% 64% Implications Sustainable growth rate based on 2021 estimates 2.21% How would an increase in profitability affect our estimate? What if Kraft-Heinz finds a way to increase its profitability? Imagine that Kraft finds a way to increase its Earnings Per Share by using its assets more efficiently and/or increasing its profit margin. As a result, it is able to increase both its Earnings Per Share and its Return on Equity (ROE). Use the following assumptions to explore this possibility: Dividend Per Share in 2021 Earnings Per Share in 2021 Return on Equity in 2021 $1.60 original estimate $3.00 an INCREASE vs our previous estimates 7.25% an INCREASE vs our previous estimates Notice how this changes the dividend payout ratio & sustainable growth rate: What will its new dividend payout ratio be based on the assumptions above? What will its new sustainable growth rate be based on the assmptions above? hint: the formula for this can be found in chapter 3 hint: the formula for this can be found in chapter 3 KRAFT HEINZ CO Current Share Price Market Cap ($m) Current Shares Outstanding (m) $36.50 44,567 1,221 Historical Financial Data Estimates INCOME STATEMENT ($m) 2016 2017 2018 2019 2020 2021 Revenues 26,487 26,232 26,268 24,977 26,185 26,447 Expenses Cost of Goods Sold Other Expenses Depreciation Total Expenses 14,794 4,199 1,337 20,330 15,169 3,263 1,036 19,468 16,183 19,142 983 15,788 4,173 994 16,045 6,871 969 23,885 16,150 4,200 969 36,308 20,955 21,319 Earnings Before Interest & Taxes 6,157 6,764 (10,040) 4,022 2,300 5,128 1,281 Interest Expense Pretax Profit 1,134 5,023 1,234 5,530 (11,321) 1,361 2,661 1,270 1,030 1,260 3,868 Income Taxes Net Income Average Tax Rate 1,381 3,642 27.5% (5,460) 10,990 -98.7% (1,067) (10,254) 9.4% 728 1,933 27.4% 669 361 65.0% 812 3,056 21.0% Per Share Information Earnings Per Share Dividend Per Share Number of shares outstanding 2.99 2.35 9.02 2.45 (8.41) 2.50 1.58 1.60 0.30 1.60 2.50 1.60 1,217.0 1,218.0 1,219.0 1,221.0 1,223.0 1,221.0 Historical Financial Data Estimates BALANCE SHEET($m) 2016 2017 2018 2019 2020 2021 ASSETS Current Assets Cash Receivables Inventories Other Current Assets Total Current Assets 4,204 898 2,684 967 8,753 1,769 1,856 2,815 826 7,266 1,163 2,281 2,667 2,964 9,075 2,280 2,146 2,721 950 8,097 3,417 2,063 2,554 2,788 10,822 3,500 2,800 2,580 2,816 11,695 Fixed Assets Net Fixed Assets 111,727 112,966 94,386 93,353 89,008 88,750 Total Assets 120,480 120,232 103,461 101,450 99,830 100,445 LIABILITIES & OWNER'S EQUITY 4,347 Current Liabilities Accounts Payable Notes Payable Other Current Liabilities Total Current Liabilities 375 3,996 2,691 2,814 9,501 4,449 3,203 2,480 10,132 4,153 398 2,952 7,503 4,003 1,175 2,697 7,875 4,304 371 3,386 8,061 3,420 8,142 Long-Term Debt Other Liabilities 29,713 23,692 28,333 15,526 30,770 13,413 28,670 13,156 28,545 12,981 28,400 12,981 Total Liabilties 62,906 53,991 51,686 49,701 49,587 49,523 Owner's Equity Common Stock & Paid-In Surplus Retained Earnings Owner's Equity 58,614 (1,040) 57,574 58,706 7,535 66,241 58,571 (6,796) 51,775 56,695 (4,946) 51,749 54,904 (4,661) 50,243 54,483 (3,560) 50,923 Total Liabilities & Owner's Equity 120,480 120,232 103,461 101,450 99,830 100,445 For Reference: Net Working Capital (748) (2,866) 1,572 222 2,761 3,554 Historical Financial Data Estimates Ratio Analysis: 2016 2017 2018 2019 2020 2021 Profitability Ratios: ROA ROE 3.0% 6.3% 9.1% 16.6% -9.9% -19.8% 1.9% 3.7% 0.4% 0.7% 3.0% 6.0% Components of DuPont Formula Net Profit Margin Total Asset Turnover Equity Multiplier 13.8% 22.0% 2.1 41.9% 21.8% 1.8 -39.0% 25.4% 2.0 7.7% 24.6% 1.4% 26.2% 2.0 11.6% 26.3% 2.0 2.0 Liquidity Ratios Current Ratio Quick Ratio Cash Ratio 0.92 0.64 0.72 0.44 0.17 1.21 0.85 0.16 1.03 0.68 0.29 1.34 1.03 0.42 1.44 1.12 0.44 0.43 Solvency Ratios Times Interest Earned Ratio Total Debt Ratio 5.4 52% 5.5 45% (7.8) 50% 3.0 49% 1.8 50% 4.1 49% Dividend Payout Dividend Payout Ratio 79% 27% -30% 101% 542% 64% Implications Sustainable growth rate based on 2021 estimates 2.21% How would an increase in profitability affect our estimate? What if Kraft-Heinz finds a way to increase its profitability? Imagine that Kraft finds a way to increase its Earnings Per Share by using its assets more efficiently and/or increasing its profit margin. As a result, it is able to increase both its Earnings Per Share and its Return on Equity (ROE). Use the following assumptions to explore this possibility: Dividend Per Share in 2021 Earnings Per Share in 2021 Return on Equity in 2021 $1.60 original estimate $3.00 an INCREASE vs our previous estimates 7.25% an INCREASE vs our previous estimates Notice how this changes the dividend payout ratio & sustainable growth rate: What will its new dividend payout ratio be based on the assumptions above? What will its new sustainable growth rate be based on the assmptions above? hint: the formula for this can be found in chapter 3 hint: the formula for this can be found in chapter 3Step by Step Solution
There are 3 Steps involved in it
Step: 1

Get Instant Access to Expert-Tailored Solutions
See step-by-step solutions with expert insights and AI powered tools for academic success
Step: 2

Step: 3
Ace Your Homework with AI
Get the answers you need in no time with our AI-driven, step-by-step assistance
Get Started
A Full Guide To Bitcoin Investment
Authors: J.b. Yupangco
1st Edition
8389911302, 978-8389911308