
Question B
1. The table below presents the temperature, in Celsius degrees, at 9pm over the last 10 days in Aberdeen:
| Day | 1 | 2 | 3 | 4 | 5 | 6 | 7 | 8 | 9 | 10 |
| Temperature | 1.5 | 2.3 | 3.7 | 3.0 | 1.4 | -1.3 | -2.4 | -3.7 | -0.5 | 1.3 |
-
- a. Calculate a 3-day moving average for each day. Indicate the value of the forecast for the temperature on day 11 at 9pm.
-
- b. Apply exponential smoothing with smoothing constant of 0.8. Indicate the value of the forecast for the temperature at 9pm on day 11.
-
- c. Briefly explain which of the two forecasts would you prefer.
- d. Box and Jenkins (1970) where the first to develop a systematic methodology which identifies and fits a combination of two processe
- e. Indicate which model Box and Jenkins (1970) identify. Briefly discuss the different components.
-
- d. The estimation model by Box and Jenkins (1970) includes an important assumption regarding the error term of the series. Clearly Indicate which assumption should be meet for the model to be accurate. Refer what should be done in a scenario that the assumption is not valid.
-
- e. Briefly indicate the reason why forecasters usually prefer the Box and Jenkins (1970) combination model.
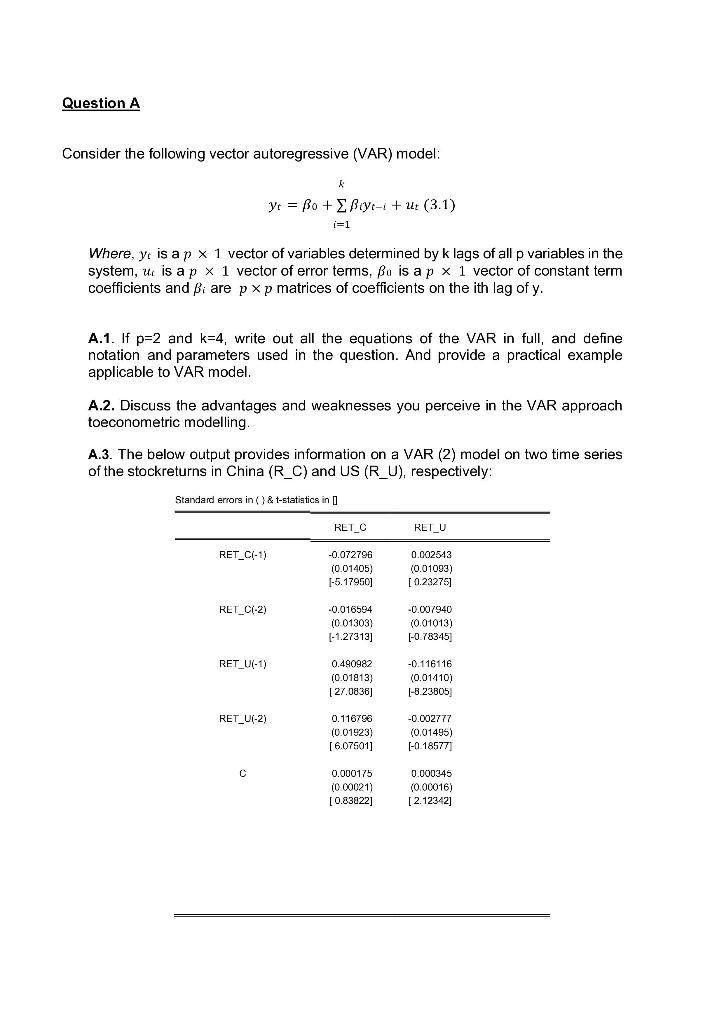
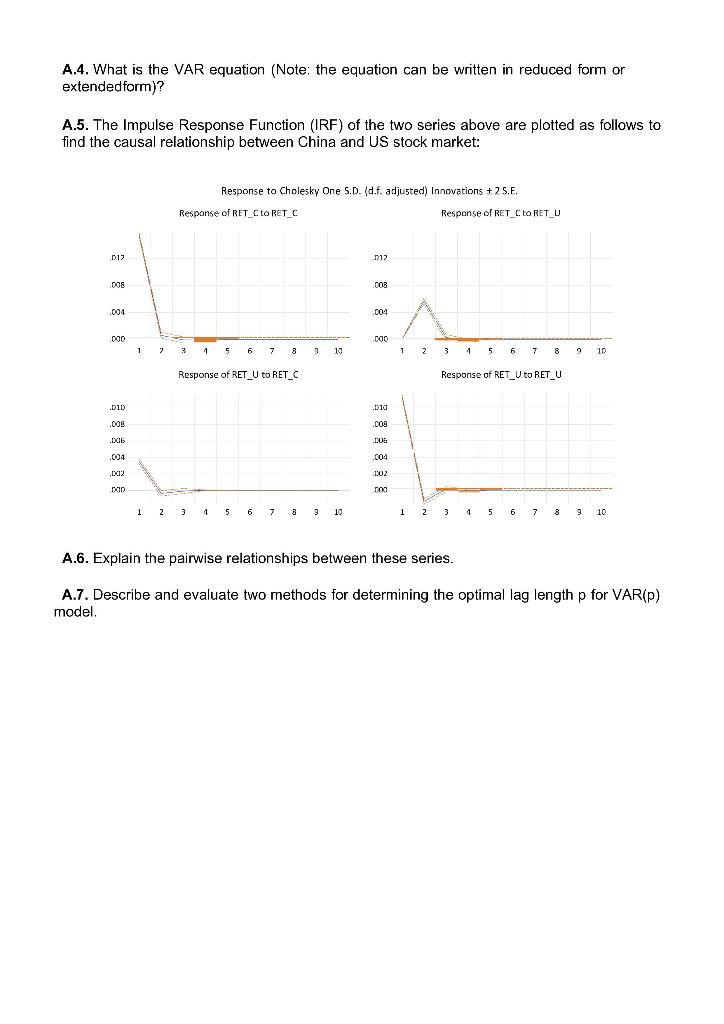
Question A Consider the following vector autoregressive (VAR) model: & Yr = Bo + Biyo-1 + u: (3.1) i=1 Where, ye is ap x 1 vector of variables determined by k lags of all p variables in the system, ut is ap x 1 vector of error terms, Bo is a p x 1 vector of constant term coefficients and Bi are p xp matrices of coefficients on the ith lag of y. A.1. If p=2 and k=4, write out all the equations of the VAR in full, and define notation and parameters used in the question. And provide a practical example applicable to VAR model. A.2. Discuss the advantages and weaknesses you perceive in the VAR approach toeconometric modelling. A.3. The below output provides information on a VAR (2) model on two time series of the stockreturns in China (R_C) and US (R_U), respectively: Standard errors in () & t-statistics in RET_C RET_U RET_C(-1) -0.072796 (0.01405) 1-5.17950] 0.002543 (0.01093) [ 0.232751 RET_C(-2) -0.016594 (001303) [-1.27313] -0.007940 (0.01013) [-0.78345) RET_U(-1) 0.490982 10.01813) [ 27.0836] -0.116116 (0.01410) |-3.23805 RET_U(-2) 0.116768 (0.01923) [6.075011 -0.002777 (0.01495) [-0.18577) 0.000175 (000021) [0.83022] 0.000345 (0.00016) [2.12342] A.4. What is the VAR equation (Note: the equation can be written in reduced form or extended form)? A.5. The Impulse Response Function (IRF) of the two series above are plotted as follows to find the causal relationship between China and US stock market: Response to Cholesky One S.D. (d.f. adjusted) Innovations + 2 5.E. Response of RET CUORET C Response of RET_CLORET U 012 . 012 008 003 .004 .004 000 000 1 2 3 4 5 6 7 39 3 10 1 2 3 4 3 4 5 6 7 6 7 8 8 9 10 Response of RET_U to RET_C Response of RET_U to RET_U .D1D .010 .006 .000 DOS .006 .004 .004 .002 .002 nan 000 1 2 5 6 7 8 9 10 6 1 2 3 4 1 5 6 6 7 8 9 10 3 A.6. Explain the pairwise relationships between these series. A.7. Describe and evaluate two methods for determining the optimal lag length p for VAR(P) model. Question A Consider the following vector autoregressive (VAR) model: & Yr = Bo + Biyo-1 + u: (3.1) i=1 Where, ye is ap x 1 vector of variables determined by k lags of all p variables in the system, ut is ap x 1 vector of error terms, Bo is a p x 1 vector of constant term coefficients and Bi are p xp matrices of coefficients on the ith lag of y. A.1. If p=2 and k=4, write out all the equations of the VAR in full, and define notation and parameters used in the question. And provide a practical example applicable to VAR model. A.2. Discuss the advantages and weaknesses you perceive in the VAR approach toeconometric modelling. A.3. The below output provides information on a VAR (2) model on two time series of the stockreturns in China (R_C) and US (R_U), respectively: Standard errors in () & t-statistics in RET_C RET_U RET_C(-1) -0.072796 (0.01405) 1-5.17950] 0.002543 (0.01093) [ 0.232751 RET_C(-2) -0.016594 (001303) [-1.27313] -0.007940 (0.01013) [-0.78345) RET_U(-1) 0.490982 10.01813) [ 27.0836] -0.116116 (0.01410) |-3.23805 RET_U(-2) 0.116768 (0.01923) [6.075011 -0.002777 (0.01495) [-0.18577) 0.000175 (000021) [0.83022] 0.000345 (0.00016) [2.12342] A.4. What is the VAR equation (Note: the equation can be written in reduced form or extended form)? A.5. The Impulse Response Function (IRF) of the two series above are plotted as follows to find the causal relationship between China and US stock market: Response to Cholesky One S.D. (d.f. adjusted) Innovations + 2 5.E. Response of RET CUORET C Response of RET_CLORET U 012 . 012 008 003 .004 .004 000 000 1 2 3 4 5 6 7 39 3 10 1 2 3 4 3 4 5 6 7 6 7 8 8 9 10 Response of RET_U to RET_C Response of RET_U to RET_U .D1D .010 .006 .000 DOS .006 .004 .004 .002 .002 nan 000 1 2 5 6 7 8 9 10 6 1 2 3 4 1 5 6 6 7 8 9 10 3 A.6. Explain the pairwise relationships between these series. A.7. Describe and evaluate two methods for determining the optimal lag length p for VAR(P) model


