

Question
Question: Companies K and L....what are their strategies and differences? One is growing aggressively - where will we see this noted? One company makes large
Question: Companies K and L....what are their strategies and differences? One is growing aggressively - where will we see this noted? One company makes large investments in new drug development while the other purchases drugs that are proven - which line item will show this difference and how? One firm borrows to fund M&As - you can see this differentiation in a line items and ratios - which ones? What about dividend policy? Which firm is which?
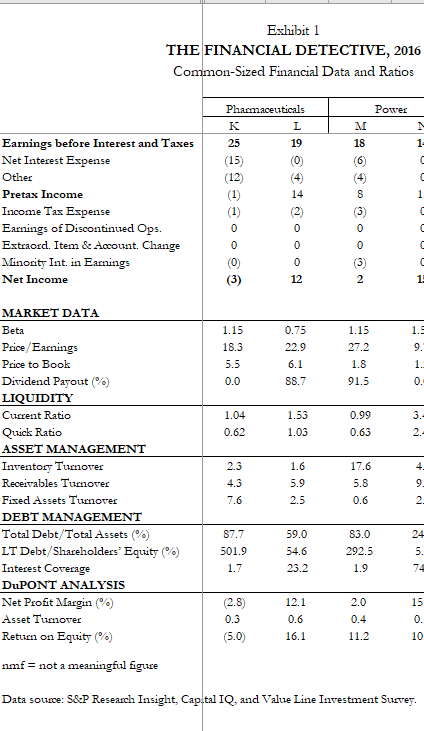
Pharmaceuticals Companies K and L manufacture and market pharmaceuticals. One firm is a diversified company that sells both human pharmaceuticals as well as health products for animals. This company's strategy is to stay ahead of the competition by investing in the discovery and development of new and innovative drugs. The other company focuses on generic pharmaceuticals and medical devices. Most of this company's growth has been inorganic-the growth strategy has been to engage in highly leveraged acquisitions, and it has participated in more than 100 during the past eight years. The goal of acquiring new businesses is to enhance the value of the proven drugs in the company's portfolio rather than gamble on discoveries of new drugs for the future. Exhibit 1 'HE FINANCIAL DETECTIVE, 2016 Common-Sized Financial Data and Ratios \begin{tabular}{l|cc|c} \cline { 2 - 4 } & \multicolumn{2}{|c|}{ Pharmaceuticals } & \\ \cline { 2 - 4 } & K & L & M \\ \hline Earnings before Interest and Taxes & 25 & 19 & 18 \\ Net Interest Expense & (15) & (0) & (6) \\ Other & (12) & (4) & (4) \\ Pretax Income & (1) & 14 & 8 \\ Income Tax Expense & (1) & (2) & (3) \\ Earnings of Discontinued Ops. & 0 & 0 & 0 \\ Extraord. Item \& Aocount. Change & 0 & 0 & 0 \\ Minority Int. in Earnings & (0) & 0 & (3) \\ Net Income & (3) & 12 & 2 \end{tabular} Power MARKET' DATA Beta Price/Earnings Price to Book Dividend Payout (\%) 1.1518.35.50.00.7522.96.188.71.1527.21.891.5 LIQUIDITY Current Ratio Quick Ratio 1.040.621.531.030.990.63 ASSET MANAGEMENT' Inventory Turnover Receivalbles Turnover Fixed Assets 'Turnover DEBT' MANAGEMENT \begin{tabular}{l|cccr} \hline Total Debt/T'otal Assets (\%) & 87.7 & 59.0 & 83.0 & 24 \\ LT' Debt/Shareholders' Equity (\%) & 501.9 & 54.6 & 292.5 & 5. \\ Interest Coverage & 1.7 & 23.2 & 1.9 & 74 \\ DuPONT ANALYSIS & & & & \\ \hline Net Profit Margin (\%) & (2.8) & 12.1 & 2.0 & 15 \\ Asset Turnover & 0.3 & 0.6 & 0.4 & 0. \\ Return on Equity (\%) & (5.0) & 16.1 & 11.2 & 10 \end{tabular} nmf = not a meaningfil figure Data source: S\&P Research Insight, Cap.tal IQ, and Value Line Investment Survey
Step by Step Solution
There are 3 Steps involved in it
Step: 1

Get Instant Access to Expert-Tailored Solutions
See step-by-step solutions with expert insights and AI powered tools for academic success
Step: 2

Step: 3
Ace Your Homework with AI
Get the answers you need in no time with our AI-driven, step-by-step assistance
Get Started
The House That Bogle Built How John Bogle And Vanguard Reinvented The Mutual Fund Industry
Authors: Lewis Braham
1st Edition
0071749063,0071751157