QUESTION

Explain cost-volume-profit analysis using the data in this question?
WHICH OF THE FOLLOWING ANSWERS ARE CORRECT? EXPLAIN WHY


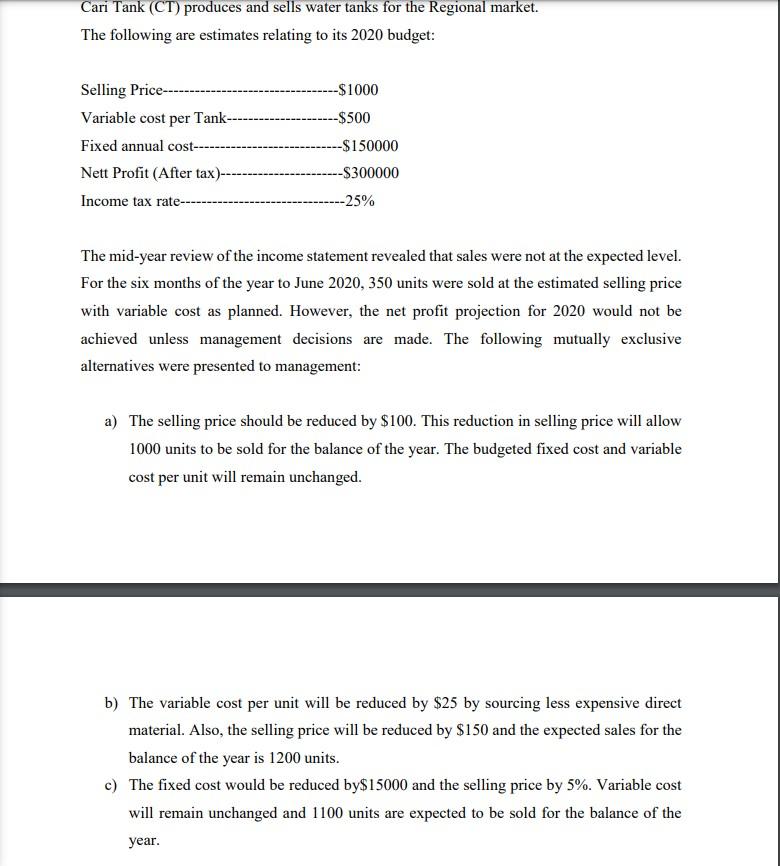
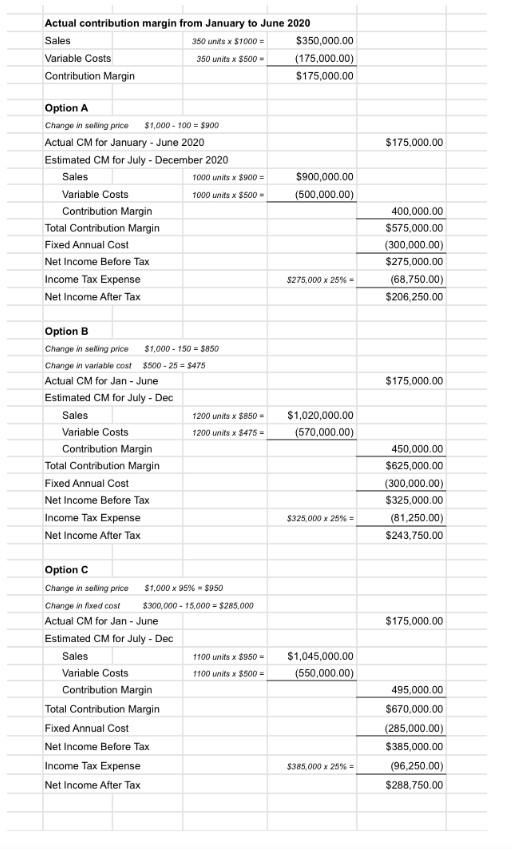
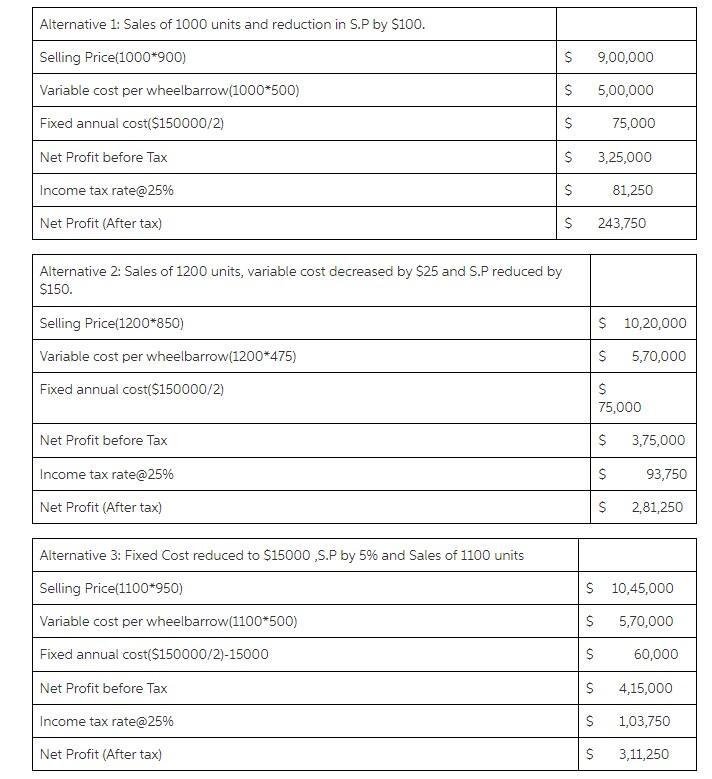
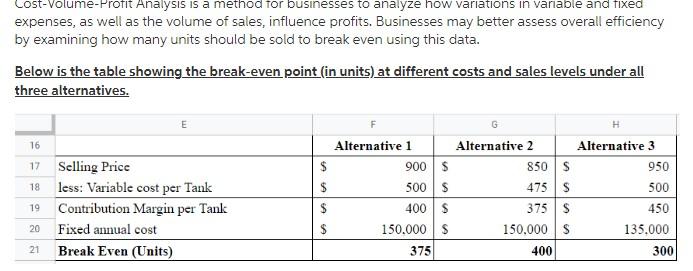
Cari Tank (CT) produces and sells water tanks for the Regional market. The following are estimates relating to its 2020 budget: Selling Price- Variable cost per Tank- Fixed annual cost- Nett Profit (After tax)-- Income tax rate- --$1000 --$500 -$150000 -$300000 -25% The mid-year review of the income statement revealed that sales were not at the expected level. For the six months of the year to June 2020, 350 units were sold at the estimated selling price with variable cost as planned. However, the net profit projection for 2020 would not be achieved unless management decisions are made. The following mutually exclusive alternatives were presented to management: a) The selling price should be reduced by $100. This reduction in selling price will allow 1000 units to be sold for the balance of the year. The budgeted fixed cost and variable cost per unit will remain unchanged. b) The variable cost per unit will be reduced by $25 by sourcing less expensive direct material. Also, the selling price will be reduced by $150 and the expected sales for the balance of the year is 1200 units. c) The fixed cost would be reduced by$15000 and the selling price by 5%. Variable cost will remain unchanged and 1100 units are expected to be sold for the balance of the year. Actual contribution margin from January to June 2020 Sales 350 units x S1000 = $350,000.00 Variable Costs 350 units X $500 - (175,000.00) Contribution Margin $175,000.00 $175,000.00 Sales $900,000.00 (500,000.00) Option A Change in saling price $1,000 - 100 = $900 Actual CM for January - June 2020 Estimated CM for July - December 2020 1000 units x $900 = Variable Costs 1000 units X $500 Contribution Margin Total Contribution Margin Fixed Annual Cost Net Income Before Tax Income Tax Expense Net Income After Tax 400,000.00 $575,000.00 (300,000.00) $275,000.00 (68.750.00) $206,250.00 $275,000 x 25% $175,000.00 Option B Change in selling price $1.000 - 150 = $850 Change in variable cost $500-25= $475 Actual CM for Jan - June Estimated CM for July - Dec Sales 1200 units x $850 - Variable Costs 1200 units x $475 Contribution Margin Total Contribution Margin Fixed Annual Cost Net Income Before Tax Income Tax Expense Net Income After Tax $1,020,000.00 (570,000.00) 450,000.00 $625,000.00 (300.000.00) $325,000.00 (81,250.00) $243,750.00 $325.000 x 25% = $175,000.00 Option C Change in selling price $1,000 x 95% - $950 Change in fixed cost $300,000 - 15,000 = $285.000 Actual CM for Jan-June Estimated CM for July - Dec Sales 1100 units x $950 - Variable Costs 1100 units X $500 = Contribution Margin Total Contribution Margin Fixed Annual Cost Net Income Before Tax Income Tax Expense Net Income After Tax $1,045,000.00 (550,000.00) 495,000.00 $670,000.00 (285,000.00) $385,000.00 (96,250,00) $288,750.00 $385.000 x 25% = Alternative 1: Sales of 1000 units and reduction in S.P by $100. Selling Price(1000*900) $ 9,00,000 Variable cost per wheelbarrow(1000*500) $ 5,00,000 Fixed annual cost($150000/2) $ 75,000 Net Profit before Tax $ 3,25,000 Income tax rate@25% $ 81,250 Net Profit (After tax) $ 243,750 Alternative 2: Sales of 1200 units, variable cost decreased by $25 and S.P reduced by $150. Selling Price(1200*850) $ 10,20,000 Variable cost per wheelbarrow(1200*475) S 5,70,000 Fixed annual cost($150000/2) $ 75,000 Net Profit before Tax $ 3,75,000 Income tax rate@25% $ 93,750 Net Profit (After tax) $ 2,81,250 Alternative 3: Fixed Cost reduced to $15000,S.P by 5% and Sales of 1100 units Selling Price(1100*950) Variable cost per wheelbarrow(1100*500) $ 10,45,000 S 5,70,000 Fixed annual cost($150000/2)-15000 60,000 $ $ Net Profit before Tax 4,15,000 Income tax rate@25% S 1,03,750 Net Profit (After tax) $ 3,11,250 Cost-Volume-Profit Analysis is a method for businesses to analyze how variations in variable and fixed expenses, as well as the volume of sales, influence profits. Businesses may better assess overall efficiency by examining how many units should be sold to break even using this data. Below is the table showing the break-even point (in units) at different costs and sales levels under all three alternatives. 16 17 $ 18 $ G Alternative 1 Alternative 2 Alternative 3 900 $ 850S 950 500 $ 475 S 500 400 $ 375$ 450 150.000 $ 150,000 $ 135.000 375 400 300 Selling Price less: Variable cost per Tank Contribution Margin per Tank Fixed annual cost Break Even (Units) 19 $ 20 21


