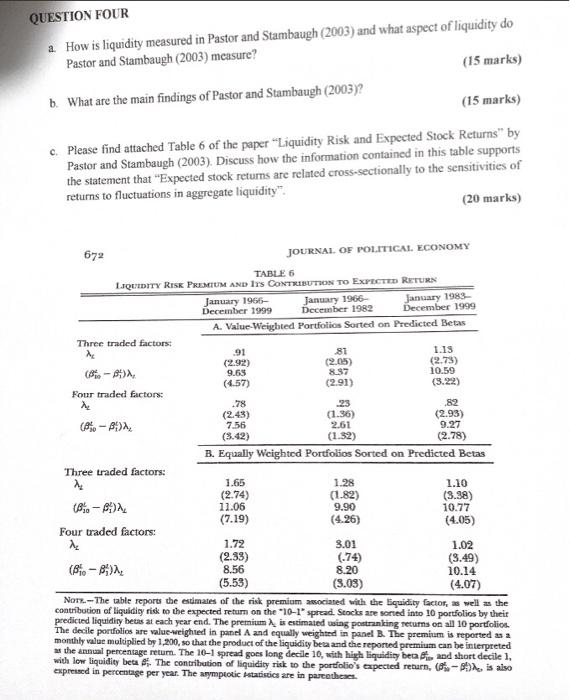
QUESTION FOUR How is liquidity measured in Pastor and Stambaugh (2003) and what aspect of liquidity do Pastor and Stambaugh (2003) measure? (15 marks) b. What are the main findings of Pastor and Stambaugh (2003)? (15 marks) c. Please find attached Table 6 of the paper "Liquidity Risk and Expected Stock Returns" by Pastor and Stambaugh (2003). Discuss how the information contained in this table supports the statement that "Expected stock returns are related cross-sectionally to the sensitivities of returns to fluctuations in aggregate liquidity": (20 marks) 672 JOURNAL OF POLITICAL ECONOMY TABLE 6 LIQUIDITY RISK PREMIUM AND ITS CONTRIBUTION TO EXPECTED RETURN January 1966- January 1966 January 1983 December 1999 December 1982 December 1999 A. Value Weighted Portfolios Sorted on Predicted Betas Three traded factors . .91 81 1.13 (2.92) (2.05) (2.73) 8.-) 9.69 8.37 10.59 (4.57) (291) Four traded factors: .78 23 .82 (2.43) (1.36) (2.93) 7.56 2.61 9.27 (3.42) (1.32) (2.78) B. Equally Weighted Portfolios Sorted on Predicted Betas Three traded factors: 1.65 1.28 1.10 (2.74) (1.82) (3.38) 11.06 9.90 10.77 (7.19) (4.26) (4.05) Four traded factors: 1.72 3.01 1.02 (2.33) (74) (3.49) (Bio- 8.56 8.20 10.14 (5.53) (3.03) (4.07) Nors.--The table reports the estimates of the risk premium associated with the liquidity factor as well as the contribution of liquidity risk to the expected return on the 10-1' spread. Scocks are sorted into 10 portfolios by their predicted liquidity hetas at each year end. The premium is estimated using postranking returns on all 10 portfolio The decile portfolios are value weighted in panel A and equally weighted in panel B. The premium is reported as a monthly value multiplied by 1,200, so that the product of the liquidity beta and the reported premium can be interpreted as the annual percentage retum. The 16-1 spread goes long decile 10, with high liquidity beca and short decile 1, with low liquidity beta. The contribution of liquidity risk to the portfolio's expected return, -, is also expressed in percentage per year. The asymptotic statistics are in parcotheses


