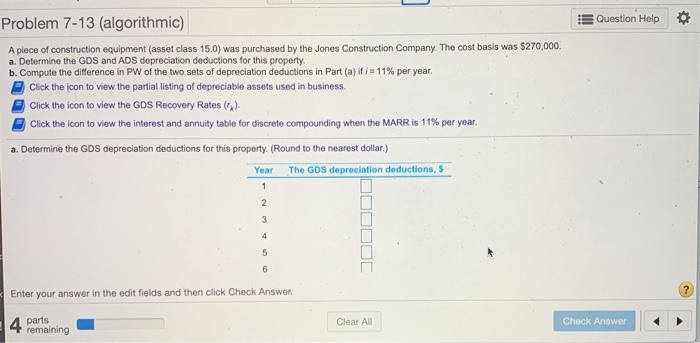
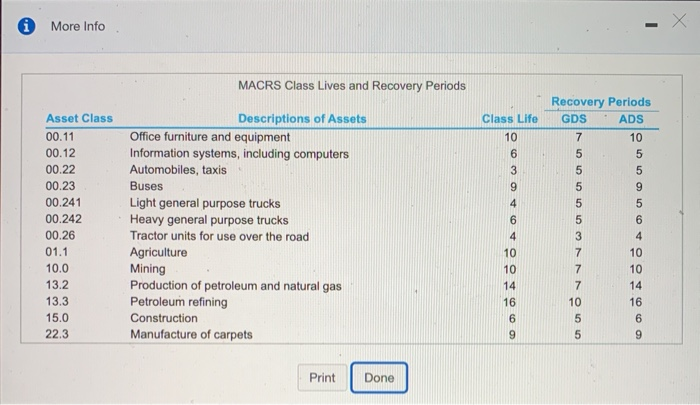
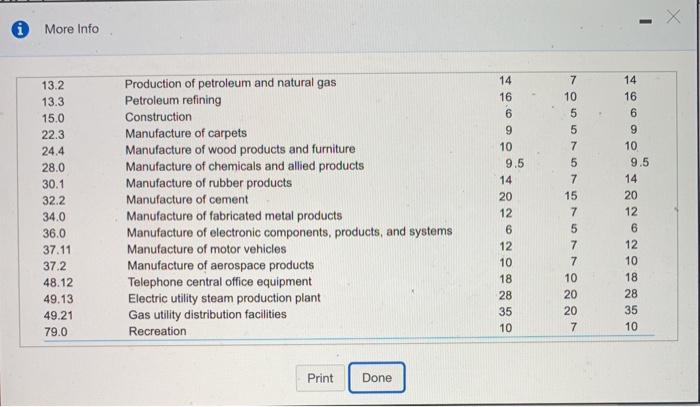
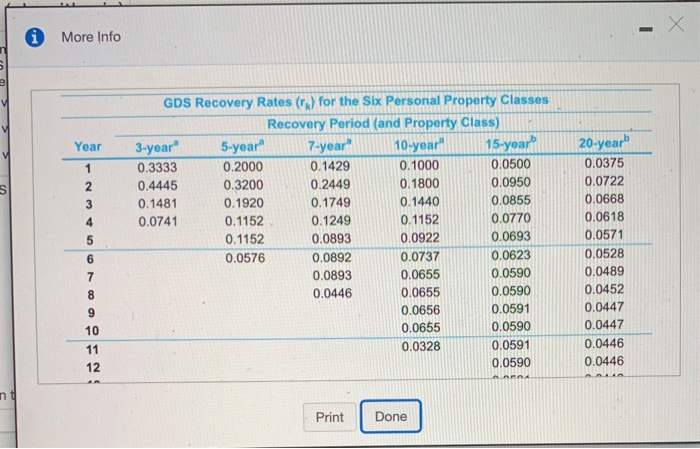
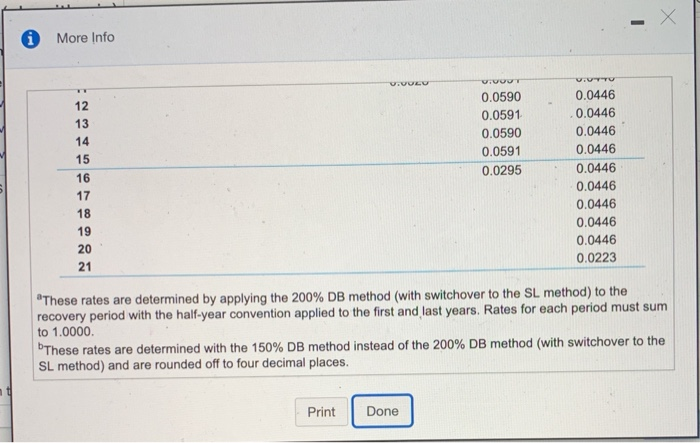
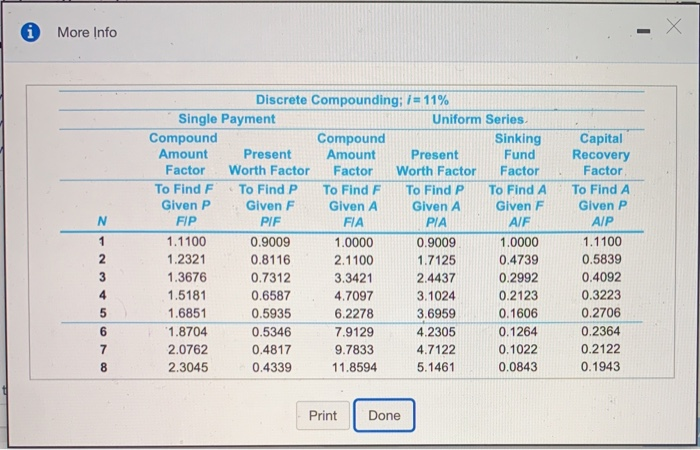
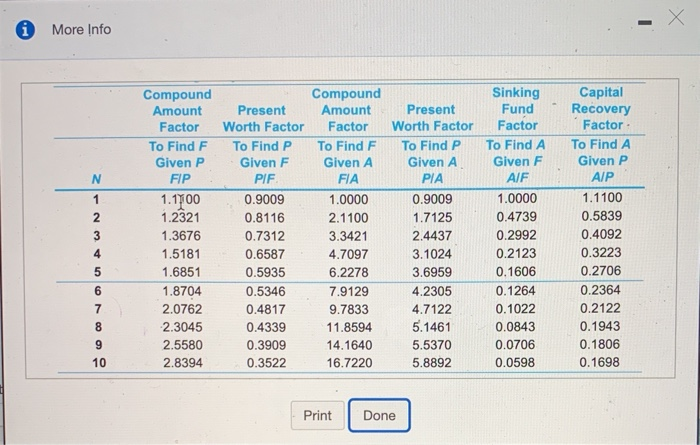
Question Help Problem 7-13 (algorithmic) A piece of construction equipment (asset class 15.0) was purchased by the Jones Construction Company. The cost basis was $270,000 a. Determine the GDS and ADS depreciation deductions for this property b. Compute the difference in PW of the two sets of depreciation deductions in Part (a) if i = 11% per year. Click the icon to view the partial listing of depreciable assets used in business. Click the icon to view the GDS Recovery Rates (). Click the icon to view the interest and annuity table for discrete compounding when the MARR is 11% per year. a. Determine the GDS depreciation deductions for this property. (Round to the nearest dollar.) Year The GDS depreciation deductions, 1 2 3 4 5 6 Enter your answer in the edit fields and then click Check Answer. 4 parts Clear All Check Answer remaining More Info MACRS Class Lives and Recovery Periods Class Life 10 6 3 9 4 Asset Class 00.11 00.12 00.22 00.23 00.241 00.242 00.26 01.1 10.0 13.2 13.3 15.0 22.3 Descriptions of Assets Office furniture and equipment Information systems, including computers Automobiles, taxis Buses Light general purpose trucks Heavy general purpose trucks Tractor units for use over the road Agriculture Mining Production of petroleum and natural gas Petroleum refining Construction Manufacture of carpets Recovery Periods GDS ADS 7 10 5 5 5 5 5 9 5 5 5 6 3 4 7 10 7 10 7 14 10 16 5 6 5 9 4 10 10 14 16 6 9 Print Done More Info 14 16 6 9 10 9.5 14 13.2 13.3 15.0 22.3 24.4 28.0 30.1 32.2 34.0 36.0 37.11 37.2 48.12 49.13 49.21 79.0 20 Production of petroleum and natural gas Petroleum refining Construction Manufacture of carpets Manufacture of wood products and furniture Manufacture of chemicals and allied products Manufacture of rubber products Manufacture of cement Manufacture of fabricated metal products Manufacture of electronic components, products, and systems Manufacture of motor vehicles Manufacture of aerospace products Telephone central office equipment Electric utility steam production plant Gas utility distribution facilities Recreation 7 10 5 5 7 5 7 15 7 5 7 7 10 20 14 16 6 9 10 9.5 14 20 12 6 12 10 18 28 35 10 12 6 12 10 18 28 35 10 20 7 Print Done X More Info M Year 2 3 4 5 GDS Recovery Rates (r) for the Six Personal Property Classes Recovery Period (and Property Class) 3-year 5-year 7-year 10-year 15-year 0.3333 0.2000 0.1429 0.1000 0.0500 0.4445 0.3200 0.2449 0.1800 0.0950 0.1481 0.1920 0.1749 0.1440 0.0855 0.0741 0.1152 0.1249 0.1152 0.0770 0.1152 0.0893 0.0922 0.0693 0.0576 0.0892 0.0737 0.0623 0.0893 0.0655 0.0590 0.0446 0.0655 0.0590 0.0656 0.0591 0.0655 0.0590 0.0328 0.0591 0.0590 20-year 0.0375 0.0722 0.0668 0.0618 0.0571 0.0528 0.0489 0.0452 0.0447 0.0447 0.0446 0.0446 6 7 8 9 10 11 12 ng Print Done A More Info V.UULU ViVOUT 0.0590 0.0591 0.0590 0.0591 0.0295 12 13 14 15 16 17 18 19 20 21 Vivy 0.0446 0.0446 0.0446 0.0446 0.0446 0.0446 0.0446 0.0446 0.0446 0.0223 *These rates are determined by applying the 200% DB method (with switchover to the SL method) to the recovery period with the half-year convention applied to the first and last years. Rates for each period must sum to 1.0000 These rates are determined with the 150% DB method instead of the 200% DB method (with switchover to the SL method) and are rounded off to four decimal places. Print Done More Info N Discrete Compounding; i = 11% Single Payment Uniform Series Compound Compound Sinking Amount Present Amount Present Fund Factor Worth Factor Factor Worth Factor Factor To Find F To Find P To Find F To Find P To Find A Given P Given F Given A Given A Given F FIP PIF FIA PIA AF 1.1100 0.9009 1.0000 0.9009 1.0000 1.2321 0.8116 2.1100 1.7125 0.4739 1.3676 0.7312 3.3421 2.4437 0.2992 1.5181 0.6587 4.7097 3.1024 0.2123 1.6851 0.5935 6.2278 3.6959 0.1606 1.8704 0.5346 7.9129 4.2305 0.1264 2.0762 0.4817 9.7833 4.7122 0.1022 2.3045 0.4339 11.8594 5.1461 0.0843 1 2 3 Capital Recovery Factor To Find A Given P AIP 1.1100 0.5839 0.4092 0.3223 0.2706 0.2364 0.2122 0.1943 4 5 6 7 8 Print Done X More Info 1 2 3 4 Compound Amount Factor To Find F Given P FIP 1.1100 1.2321 1.3676 1.5181 1.6851 1.8704 2.0762 2.3045 2.5580 2.8394 Compound Present Amount Worth Factor Factor To Find P To Find F Given F Given A PIF FIA 0.9009 1.0000 0.8116 2.1100 0.7312 3.3421 0.6587 4.7097 0.5935 6.2278 0.5346 7.9129 0.4817 9.7833 0.4339 11.8594 0.3909 14.1640 0.3522 16.7220 Present Worth Factor To Find P Given A PIA 0.9009 1.7125 2.4437 3.1024 3.6959 4.2305 4.7122 5.1461 5.5370 5.8892 Sinking Fund Factor To Find A Given F AIF 1.0000 0.4739 0.2992 0.2123 0.1606 0.1264 0.1022 0.0843 0.0706 0.0598 Capital Recovery Factor To Find A Given P AIP 1.1100 0.5839 0.4092 0.3223 0.2706 0.2364 0.2122 0.1943 0.1806 0.1698 6 7 8 9 10 Print Done Question Help Problem 7-13 (algorithmic) A piece of construction equipment (asset class 15.0) was purchased by the Jones Construction Company. The cost basis was $270,000 a. Determine the GDS and ADS depreciation deductions for this property b. Compute the difference in PW of the two sets of depreciation deductions in Part (a) if i = 11% per year. Click the icon to view the partial listing of depreciable assets used in business. Click the icon to view the GDS Recovery Rates (). Click the icon to view the interest and annuity table for discrete compounding when the MARR is 11% per year. a. Determine the GDS depreciation deductions for this property. (Round to the nearest dollar.) Year The GDS depreciation deductions, 1 2 3 4 5 6 Enter your answer in the edit fields and then click Check Answer. 4 parts Clear All Check Answer remaining More Info MACRS Class Lives and Recovery Periods Class Life 10 6 3 9 4 Asset Class 00.11 00.12 00.22 00.23 00.241 00.242 00.26 01.1 10.0 13.2 13.3 15.0 22.3 Descriptions of Assets Office furniture and equipment Information systems, including computers Automobiles, taxis Buses Light general purpose trucks Heavy general purpose trucks Tractor units for use over the road Agriculture Mining Production of petroleum and natural gas Petroleum refining Construction Manufacture of carpets Recovery Periods GDS ADS 7 10 5 5 5 5 5 9 5 5 5 6 3 4 7 10 7 10 7 14 10 16 5 6 5 9 4 10 10 14 16 6 9 Print Done More Info 14 16 6 9 10 9.5 14 13.2 13.3 15.0 22.3 24.4 28.0 30.1 32.2 34.0 36.0 37.11 37.2 48.12 49.13 49.21 79.0 20 Production of petroleum and natural gas Petroleum refining Construction Manufacture of carpets Manufacture of wood products and furniture Manufacture of chemicals and allied products Manufacture of rubber products Manufacture of cement Manufacture of fabricated metal products Manufacture of electronic components, products, and systems Manufacture of motor vehicles Manufacture of aerospace products Telephone central office equipment Electric utility steam production plant Gas utility distribution facilities Recreation 7 10 5 5 7 5 7 15 7 5 7 7 10 20 14 16 6 9 10 9.5 14 20 12 6 12 10 18 28 35 10 12 6 12 10 18 28 35 10 20 7 Print Done X More Info M Year 2 3 4 5 GDS Recovery Rates (r) for the Six Personal Property Classes Recovery Period (and Property Class) 3-year 5-year 7-year 10-year 15-year 0.3333 0.2000 0.1429 0.1000 0.0500 0.4445 0.3200 0.2449 0.1800 0.0950 0.1481 0.1920 0.1749 0.1440 0.0855 0.0741 0.1152 0.1249 0.1152 0.0770 0.1152 0.0893 0.0922 0.0693 0.0576 0.0892 0.0737 0.0623 0.0893 0.0655 0.0590 0.0446 0.0655 0.0590 0.0656 0.0591 0.0655 0.0590 0.0328 0.0591 0.0590 20-year 0.0375 0.0722 0.0668 0.0618 0.0571 0.0528 0.0489 0.0452 0.0447 0.0447 0.0446 0.0446 6 7 8 9 10 11 12 ng Print Done A More Info V.UULU ViVOUT 0.0590 0.0591 0.0590 0.0591 0.0295 12 13 14 15 16 17 18 19 20 21 Vivy 0.0446 0.0446 0.0446 0.0446 0.0446 0.0446 0.0446 0.0446 0.0446 0.0223 *These rates are determined by applying the 200% DB method (with switchover to the SL method) to the recovery period with the half-year convention applied to the first and last years. Rates for each period must sum to 1.0000 These rates are determined with the 150% DB method instead of the 200% DB method (with switchover to the SL method) and are rounded off to four decimal places. Print Done More Info N Discrete Compounding; i = 11% Single Payment Uniform Series Compound Compound Sinking Amount Present Amount Present Fund Factor Worth Factor Factor Worth Factor Factor To Find F To Find P To Find F To Find P To Find A Given P Given F Given A Given A Given F FIP PIF FIA PIA AF 1.1100 0.9009 1.0000 0.9009 1.0000 1.2321 0.8116 2.1100 1.7125 0.4739 1.3676 0.7312 3.3421 2.4437 0.2992 1.5181 0.6587 4.7097 3.1024 0.2123 1.6851 0.5935 6.2278 3.6959 0.1606 1.8704 0.5346 7.9129 4.2305 0.1264 2.0762 0.4817 9.7833 4.7122 0.1022 2.3045 0.4339 11.8594 5.1461 0.0843 1 2 3 Capital Recovery Factor To Find A Given P AIP 1.1100 0.5839 0.4092 0.3223 0.2706 0.2364 0.2122 0.1943 4 5 6 7 8 Print Done X More Info 1 2 3 4 Compound Amount Factor To Find F Given P FIP 1.1100 1.2321 1.3676 1.5181 1.6851 1.8704 2.0762 2.3045 2.5580 2.8394 Compound Present Amount Worth Factor Factor To Find P To Find F Given F Given A PIF FIA 0.9009 1.0000 0.8116 2.1100 0.7312 3.3421 0.6587 4.7097 0.5935 6.2278 0.5346 7.9129 0.4817 9.7833 0.4339 11.8594 0.3909 14.1640 0.3522 16.7220 Present Worth Factor To Find P Given A PIA 0.9009 1.7125 2.4437 3.1024 3.6959 4.2305 4.7122 5.1461 5.5370 5.8892 Sinking Fund Factor To Find A Given F AIF 1.0000 0.4739 0.2992 0.2123 0.1606 0.1264 0.1022 0.0843 0.0706 0.0598 Capital Recovery Factor To Find A Given P AIP 1.1100 0.5839 0.4092 0.3223 0.2706 0.2364 0.2122 0.1943 0.1806 0.1698 6 7 8 9 10 Print Done
