Answered step by step
Verified Expert Solution
Link Copied!

Question

1 Approved Answer

Question Help The comparative financial statements of Norfolk Cosmetic Supply for 2018, 2017 and 2016 include the data shown here (Click the icon to view
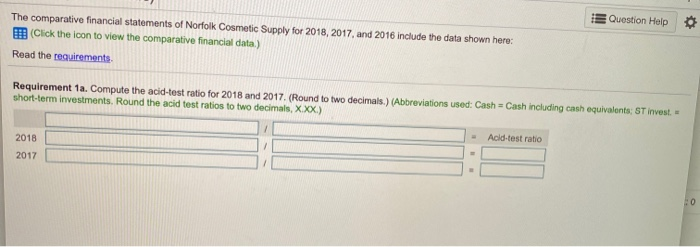
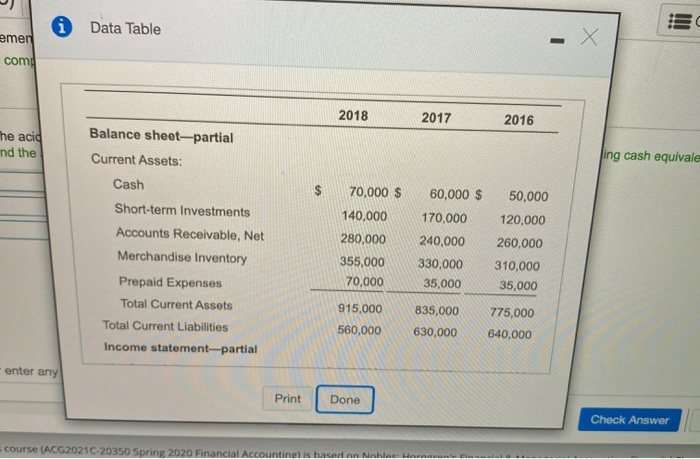
image text in transcribed
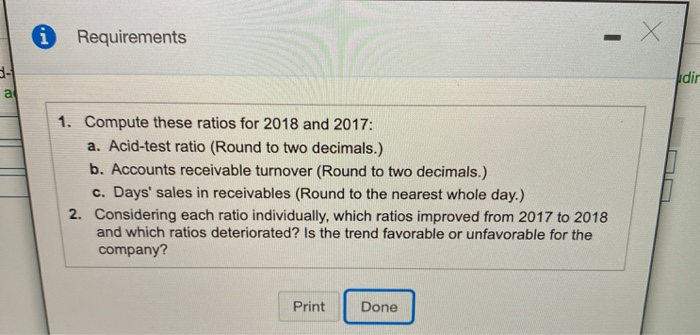
Question Help The comparative financial statements of Norfolk Cosmetic Supply for 2018, 2017 and 2016 include the data shown here (Click the icon to view the comparative financial data.) Read the requirements Requirement 1a. Compute the acid-test ratio for 2018 and 2017. (Round to two decimals.) (Abbreviations used: Cash short-term investments. Round the acid test ratios to two decimals, XXX) Cash including cash equivalents: ST invest. = Acid-test ratio 2018 2017 Data Table emer com 2018 2017 2016 me acid nd the ing cash equivale | $ Balance sheet-partial Current Assets: Cash Short-term Investments Accounts Receivable, Net Merchandise Inventory Prepaid Expenses Total Current Assets Total Current Liabilities Income statement--partial 70,000 $ 140,000 280,000 355,000 70,000 60,000 $ 170,000 240,000 330,000 35,000 835,000 630,000 50,000 120,000 260,000 310,000 35,000 775,000 640,000 915,000 560,000 enter any Print Done Check Answer Course (ACG202120350 Spring 2020 Financial Accountine is based on Nashee n Data Table ling Balance sheet-partial Current Assets: Cash Short-term Investments Accounts Receivable, Net Merchandise Inventory Prepaid Expenses Total Current Assets Total Current Liabilities Income statement-partial Net Sales (all on account) 70,000 $ 140,000 280,000 355,000 70,000 915,000 560,000 60,000 $ 170,000 240,000 330,000 35,000 835,000 630,000 50,000 120,000 260,000 310,000 35,000 775,000 640,000 5,890,000 5,130,000 4,210,000 Print Done Che i Requirements 1. Compute these ratios for 2018 and 2017: a. Acid-test ratio (Round to two decimals.) b. Accounts receivable turnover (Round to two decimals.) c. Days' sales in receivables (Round to the nearest whole day.) 2. Considering each ratio individually, which ratios improved from 2017 to 2018 and which ratios deteriorated? Is the trend favorable or unfavorable for the company? Print Done
Step by Step Solution

There are 3 Steps involved in it

Step: 1

blur-text-image

Get Instant Access to Expert-Tailored Solutions

See step-by-step solutions with expert insights and AI powered tools for academic success

Step: 2

blur-text-image

Step: 3

blur-text-image

Ace Your Homework with AI

Get the answers you need in no time with our AI-driven, step-by-step assistance

Get Started

Recommended Textbook for

The Wall Street Mba

Authors: Reuben Advani

2nd Edition

007178831X, 9780071788311

More Books

Students also viewed these Accounting questions

Question

How can an S corporation avoid the passive investment income tax?

Answered: 1 week ago

Question

Find a general term a, for the geometric sequence. az = 9, r =

Answered: 1 week ago

Question

How do you know when you have done quality work?

Answered: 1 week ago

Question

Show the properties and structure of allotropes of carbon.

Answered: 1 week ago