

Answered step by step
Verified Expert Solution
Question
1 Approved Answer
QUESTION II: THE S&P 5 0 0 INCLUDSION ANOMALY. Fig. 2 . 4 Mean Cumulative Abnormal Returns For Stocks Added To the S&P 5 0
QUESTION II: THE S&P INCLUDSION ANOMALY.
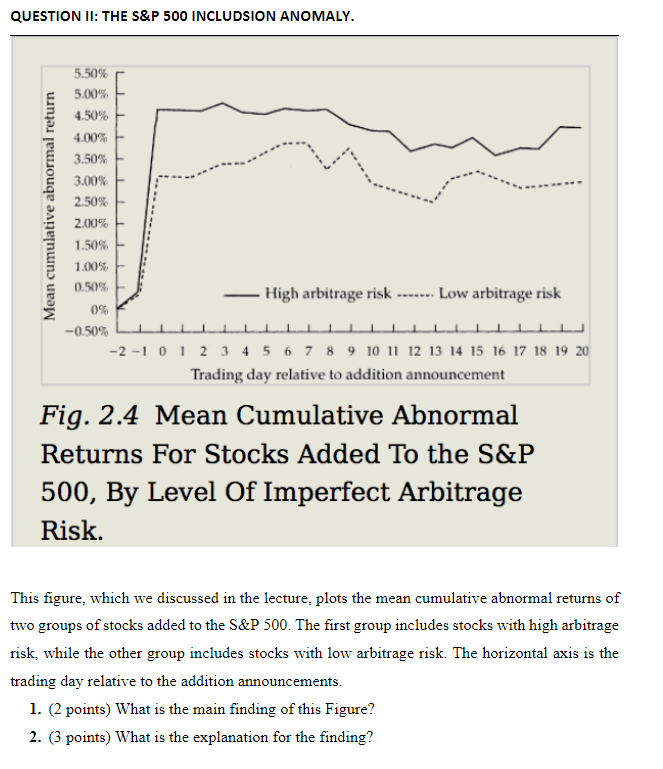
Fig. Mean Cumulative Abnormal
Returns For Stocks Added To the S&P
By Level Of Imperfect Arbitrage
Risk.
This figure, which we discussed in the lecture, plots the mean cumulative abnormal returns of
two groups of stocks added to the S&P The first group includes stocks with high arbitrage
risk, while the other group includes stocks with low arbitrage risk. The horizontal axis is the
trading day relative to the addition announcements.
What is the main finding of this Figure?
What is the explanation for the finding?
Step by Step Solution
There are 3 Steps involved in it
Step: 1

Get Instant Access to Expert-Tailored Solutions
See step-by-step solutions with expert insights and AI powered tools for academic success
Step: 2

Step: 3
Ace Your Homework with AI
Get the answers you need in no time with our AI-driven, step-by-step assistance
Get Started
Dividend Policy On Share Price Volatility In Indian Stock Market
Authors: Vijay Deswal
1st Edition
3841859623, 978-3841859624