question in the final
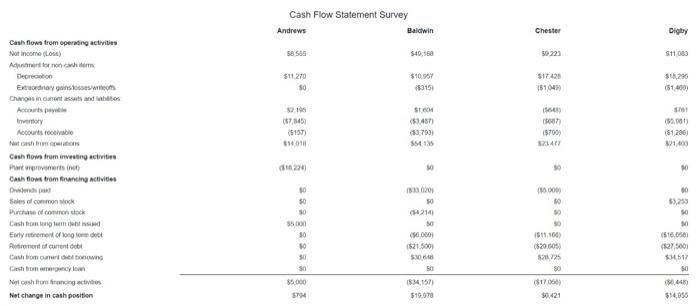
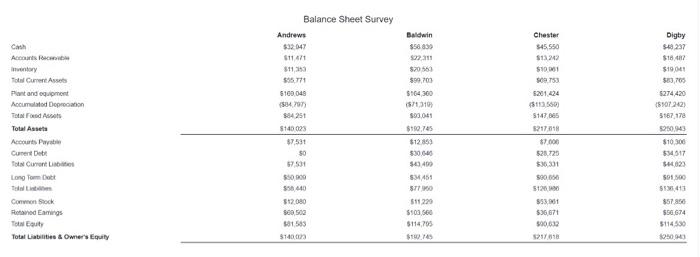
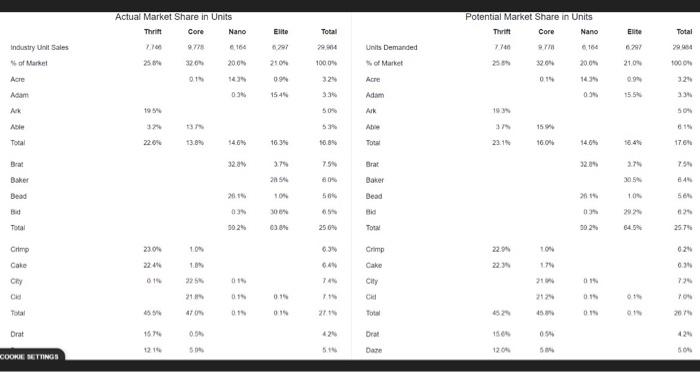
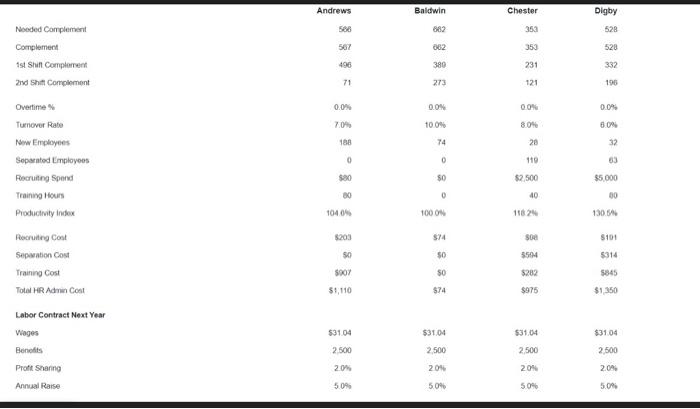
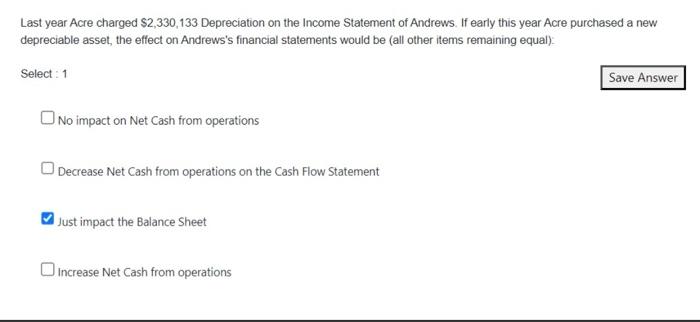
\begin{tabular}{|c|c|c|c|c|} \hline \multicolumn{5}{|c|}{ Balance Sheet Survey } \\ \hline & Andrews & Baldwin & Chester & Digby \\ \hline Cash & 532:047 & & 345,550 & \\ \hline Acrounts Pescroibs & $11,471 & sonans & 513242 & $18,487 \\ \hline imsintory & 311,253 & $20563 & swowi & $19001 \\ \hline fots CumereAsseb & & 590,700 & soerse & 803,65 \\ \hline Plont and equipment & 5169,049 & Sted, 300 & 5201,424 & 5274,420 \\ \hline Accumulstod Doprooanon & (\$, 9) & & (5112500) & (5507,2021 \\ \hline Tatas rosed Asoots. & 3425t & s90,01 & 5147,065 & 5567,173 \\ \hline Total Asseta & $140023 & $190,765 & 2:17.018 & \\ \hline Accicurts Paritien & 87.531 & $12359 & 57.000 & $10,900 \\ \hline Cunere Doth & 50 & $30040 & & 534 317 \\ \hline fots Cument Listitet & & $0,400 & $36.331 & sutan \\ \hline Lono Fom Doet & 580,909 & SM,45s & & 501,500 \\ \hline Tad tintaline & s50,440 & & 5120,100 & 558,413 \\ \hline Conmon Sock. & 512,080 & 511229 & s53,plt & 857.956 \\ \hline Rhenansod Eamirgs & 500,500 & s500,560 & $30,671 & $56,674 \\ \hline Foul Eouty & 841,543 & 5114,705 & & 5114$30 \\ \hline Totat Labilities as Omners Equity & $14000 & stue thes & seston & \\ \hline \end{tabular} \begin{tabular}{|c|c|c|c|c|c|} \hline \multicolumn{6}{|c|}{ Income Statement Survey } \\ \hline & & Andrem & Baldwin & Chester & Digby \\ \hline Seles & & $39,501 & $271.449 & 5+64,41 & $200,500 \\ \hline & * & Mis, 144 & 8155354 & sen160 & $121,000 \\ \hline Contrbutoon Mrron & & $34,417 & $110005 & 500,945 & sra,sog \\ \hline Derancinon & & 5$1270 & $10057 & & $14,295 \\ \hline & & 113220 & $14.297 & 515,547 & 121,013 \\ \hline Other ffees. Whith. Tom Bocises & & sass & moso & Mose & \\ \hline EeIT & & wooft & & $30351 & $34,090 \\ \hline interes ishort serm, tono termi! & & seces & & 595073 & stesess \\ \hline Tanos & & 4.701 & $27.015 & $5.000 & N.000 \\ \hline Prof sharne & & sats & $1.000 & $190 & cos0 \\ \hline Hein Frode & & 10:56s & 540160 & sam & t11,ces \\ \hline \end{tabular} Top Products in Elite Segment \begin{tabular}{|c|c|c|c|c|c|c|c|c|c|c|c|} \hline \multicolumn{6}{|c|}{ Actual Market Share in Units } & \multicolumn{6}{|c|}{ Potential Market Share in Units } \\ \hline & Thrift & Core & Nano & Ellte & Total & & Thrift & Core & Nano & Elite & Total \\ \hline industry Unit sales & 8,100 & & e.160 & 0.201 & 79sin4 & Units Demanded & & & 0.164 & & 2004 \\ \hline Nof Market & 2564 & 3200 & 200s & 2500 & 1000N & th of Market & 250 & 3204 & 2005 & 21.04 & 100cos \\ \hline Acre & & 010 & sen & as & 324 & Acre: & & 0:4 & 1435 & log & 326 \\ \hline Aasm & & & 0.36 & 1545 & 3.3% & Adim & & & & 15.50 & 336 \\ \hline Aok. & toss & & & & 505 & Avk & log & & & & sos \\ \hline Nie & 374 & tg & & & 53% & Abre & 3m & 15% & & & 615 \\ \hline Tocal & 220% & 13.0s & 146s & 1634 & 10.8% & Tonet & 23.1N & 16.0h & 14.0s & t. 45 & 176n \\ \hline Brat & & & 32av & 2 & 75 & Brat & & & & & 250 \\ \hline Bsker & & & & zasth & fos & Baker & & & & 30.5m & 6. 44 \\ \hline Dead & & & & sin & 56% & Besd & & & 2n+5 & 100 & \\ \hline Bint & & & 035 & yoen & ons & Eid & & & om & 2027 & 624 \\ \hline Tocal & & & 502b & cos & 250% & Trax & & & 502b & 64.5% & 25.74 \\ \hline Crimp & non & 100 & & & & Grimp & 22% & 10n & & & 62% \\ \hline Cale & 2246 & 1.00 & & & & Cake & & 10 & & & 0.2n \\ \hline Cry & 616 & & 018 & & & City & & mon & & & \\ \hline cks & & 21.175 & & 0.18 & & cal & & 2120 & 0.18 & & 100 \\ \hline Folal & s & af in & 0.15 & 018 & 2t+5 & total & 420 & & 0ks & & 20m \\ \hline Orat & 1674 & 0.56 & & & 428 & Drat & ises & 054 & & & 420 \\ \hline & & 506 & & & 5+6 & base & 1204 & 5en & & & 50c \\ \hline \end{tabular} \begin{tabular}{|c|c|c|c|c|} \hline & Andrews & Baldwin & Chester & Digby \\ \hline Nooded Complement & 566 & 682 & 353 & 528 \\ \hline Complement & 567 & 062 & 353 & 520 \\ \hline ist Shift Compiarrent & 496 & 380 & 231 & 332 \\ \hline and Shat Comploment & & 273 & 121 & 196 \\ \hline Overtime s & 0.0% & 0.0N & 0.0N & 0.0% \\ \hline Tumever Rabe & 7.0m & 100% & 8.04 & \\ \hline New Employees & 188 & 74 & 28 & 32 \\ \hline Seperatod Limpioyees & 0 & 0 & 110 & 63 \\ \hline Pecrueting Spend & $20 & $0 & $2.500 & $5.000 \\ \hline Trainng tiours & & 0 & 40 & 60 \\ \hline Productivity indox & 1040s & 100os & 11824 & 130.56 \\ \hline Pocruitre Cost & 5203 & 574 & seet & 8104 \\ \hline Sepusation Cost & 50 & 50 & 55sin & $314 \\ \hline Training Cost & 5x07 & so & $282 & 5845 \\ \hline Totel HR Adrin Cost & $1,110 & $74 & $975 & $1,350 \\ \hline \multicolumn{5}{|l|}{ Labor Contract Next Year } \\ \hline Wages & $31.04 & $31.04 & $31.04 & $31.04 \\ \hline Benofits & 2,500 & 2.500 & 2.500 & 2,500 \\ \hline Proth Shanng & 20m & 204 & 20m & 200% \\ \hline Annual Rarse & 509% & & 50% & 5.00% \\ \hline \end{tabular} Last year Acre charged \$2,330,133 Depreciation on the Income Statement of Andrews. If early this year Acre purchased a new depreciable asset, the effect on Andrews's financial statements would be (all other items remaining equal): Select : 1 No impact on Net Cash from operations Decrease Net Cash from operations on the Cash Flow Statement Just impact the Balance Sheet Increase Net Cash from operations


