QUESTION (Marks allocation is 40%) To achieve Course Learning Outcome 2 - Appraise accounting data using appropriate techniques for planning and control Based on the
QUESTION (Marks allocation is 40%) To achieve Course Learning Outcome 2 - Appraise accounting data using appropriate techniques for planning and control
Based on the two companies below:
1. Dutch Lady
2.Farm Fresh.
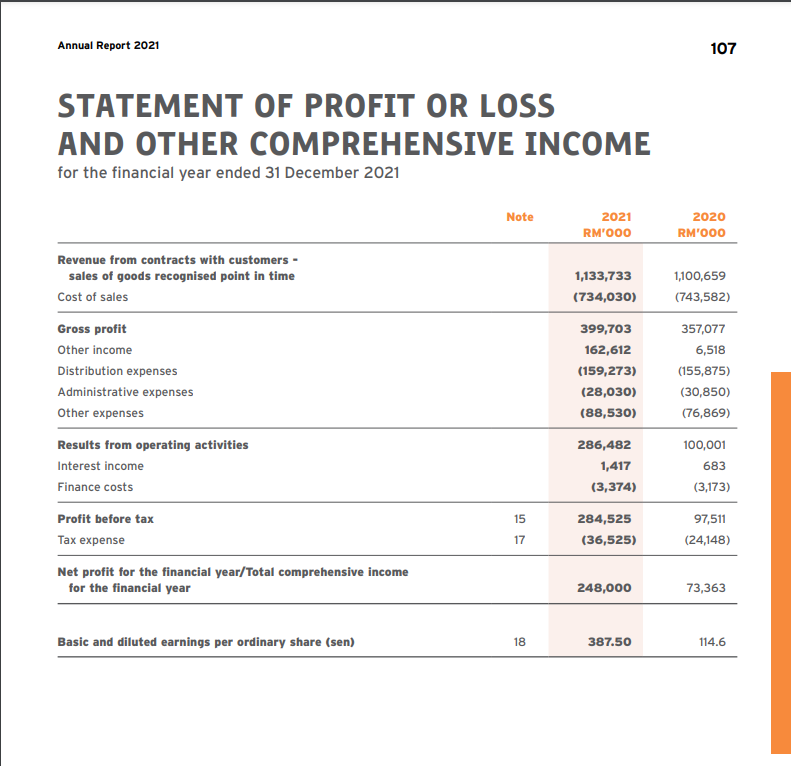
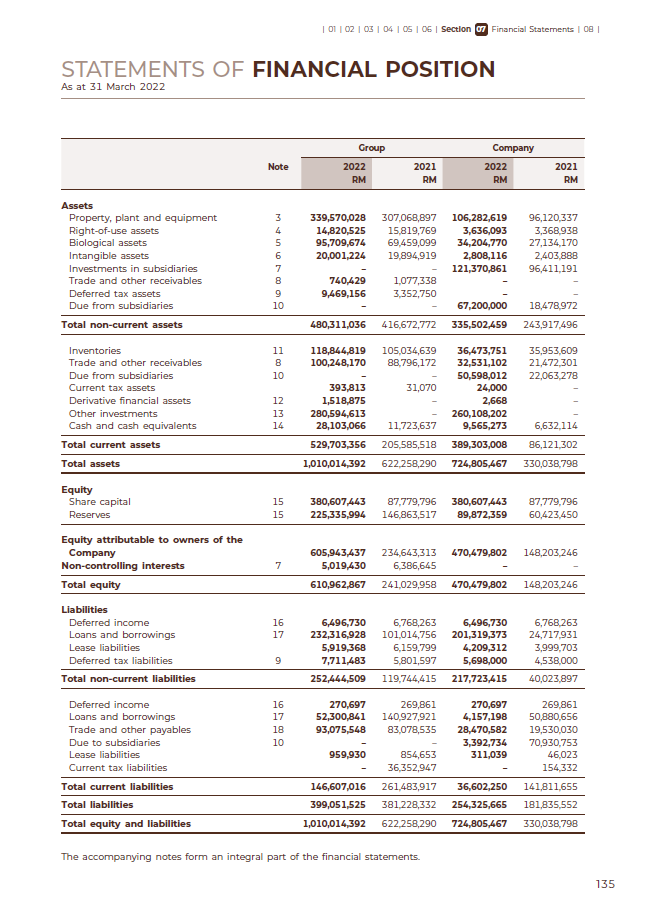
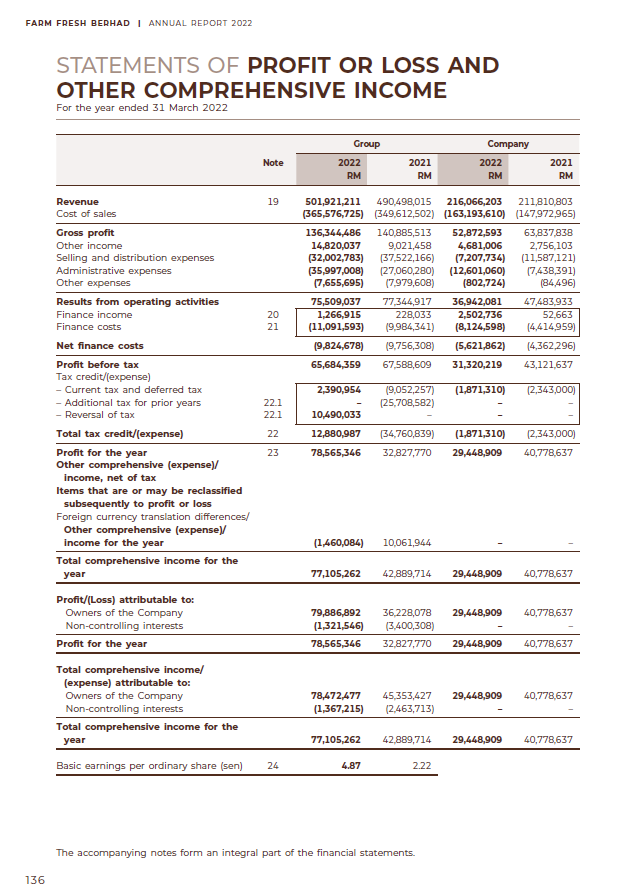
Analyze theirs financial strengths and weaknesses by refering to the companys' Profit and Loss and Balance Sheet Statements by using financial ratios.
The financial ratios may consists of at least THREE (3) of each of the following ratios;
1. profitability,
2. liquidity and
3. long-term solvency ratios.
Critically evaluate the findings and provide recommendations to the organisation to improve its operation
Annual Report 2021 107 STATEMENT OF PROFIT OR LOSS AND OTHER COMPREHENSIVE INCOME for the financial year ended 31 December 2021 Note 2021 2020 RM'000 RM'000 Revenue from contracts with customers - sales of goods recognised point in time 1,133,733 1,100,659 Cost of sales (734,030) (743,582) Gross profit 399,703 357,077 Other income 162,612 6,518 Distribution expenses (159,273) (155,875) Administrative expenses (28,030) (30,850) Other expenses (88,530) (76,869) Results from operating activities 286,482 100,001 Interest income 1,417 683 Finance costs (3,374) (3,173) Profit before tax 15 284,525 97,511 Tax expense 17 (36,525) (24,148) Net profit for the financial year/Total comprehensive income for the financial year 248,000 73,363 Basic and diluted earnings per ordinary share (sen) 18 387.50 114.6Annual Report 2021 107 STATEMENT OF PROFIT OR LOSS AND OTHER COMPREHENSIVE INCOME for the financial year ended 31 December 2021 Note 2021 2020 RM'000 RM'000 Revenue from contracts with customers - sales of goods recognised point in time 1,133,733 1,100,659 Cost of sales (734,030) (743,582) Gross profit 399,703 357,077 Other income 162,612 6,518 Distribution expenses (159,273) (155,875) Administrative expenses (28,030) (30,850) Other expenses (88,530) (76,869) Results from operating activities 286,482 100,001 Interest income 1,417 683 Finance costs (3,374) (3,173) Profit before tax 15 284,525 97,511 Tax expense 17 (36,525) (24,148) Net profit for the financial year/Total comprehensive income for the financial year 248,000 73,363 Basic and diluted earnings per ordinary share (sen) 18 387.50 114.6| 01 1 02 1 03 1 04 | 05 | 06 | Section 07] Financial Statements | 08 | STATEMENTS OF FINANCIAL POSITION As at 31 March 2022 Group Company Note 2027 2021 2022 2021 RM RM RM RM Assets Property, plant and equipment 339,570,028 307,068,897 106,282,619 96,120,337 Right-of-use assets 14,820,525 15,819,769 3,636,093 3,368938 Biological assets 95,709,674 69,459,099 34,204,770 27,134,170 Intangible assets 20,001,224 19.894,919 2,808,116 2,403,888 Investments in subsidiaries 121,370,861 96,411,191 Trade and other receivables 740,429 1,077,338 Deferred tax assets 9 9,469,156 3,352,750 Due from subsidiaries 10 67,200,000 18,478,972 Total non-current assets 480,311,036 416,672,772 335,502,459 243,917,496 Inventories 11 118,844,819 105 034,639 36,473,751 35,953,609 Trade and other receivables B 100,248,170 88,796,172 32,531,102 21,472,301 Due from subsidiaries 10 50,598,012 22,063,278 Current tax assets 393,813 31,070 24,000 Derivative financial assets 12 1,518,875 2,668 Other investments 13 280,594,613 260,108,202 Cash and cash equivalents 16 28,103,066 11,723,637 9,565,273 6,632,114 Total current assets 529,703,356 205,585,518 389,303,008 86,121,302 Total assets 1,010,014,392 622,258,290 724,805,467 330,038,798 Equity Share capital 15 380,607,443 87,779,796 0,607,443 87,779,796 Reserves 15 225,335,994 146,863,517 89,872,359 60.423,450 Equity attributable to owners of the Company 605,943,437 234,643,313 470,479,802 148,203,246 Non-controlling interests 7 5,019,430 6,386,645 Total equity 610,962,867 241,029,958 470,479,802 148,203,246 Liabilities Deferred income 16 6,496,730 6.768,263 6,496,730 6,768,263 Loans and borrowings 17 232,316,928 101,014,756 201,319,373 24,717,931 Lease liabilities 5,919,368 6,159,799 4,209,312 3,999,703 Deferred tax liabilities 7,711,483 5.801,597 5,698.000 4.538.000 Total non-current liabilities 252,444,509 119,744,415 217,723,415 40,023,897 Deferred income 16 270,697 269,861 270,697 269,861 Loans and borrowings 17 52,300,841 140.927,921 4,157,198 50,880,656 Trade and other payables 18 93,075,548 83,078,535 28,470,582 19,530,030 Due to subsidiaries 10 3,392,734 70,930,753 Lease liabilities 959,930 854,653 311,039 46.023 Current tax liabilities 36.352,947 154,332 Total current liabilities 146,607,016 261,483,917 36,602,250 141,811,655 Total liabilities 399,051,525 381,228,332 254,325,665 181,835,552 Total equity and liabilities 1,010,014,392 622,258,290 724,805,467 330,038,798 The accompanying notes form an integral part of the financial statements. 135FARM FRESH BERHAD | ANNUAL REPORT 2022 STATEMENTS OF PROFIT OR LOSS AND OTHER COMPREHENSIVE INCOME For the year ended 31 March 2022 Group Company Note 2022 2021 2022 2021 RM RM RM RM Revenue 19 501,921,211 490,498,015 216,066,203 211,810,803 Cost of sales (365,576,725) (349.612,502) (163,193,610) (147,972,965) Gross profit 136,344,486 140,885,513 52,872,593 63,837,838 Other income 14,820,037 9,021,458 4,681,006 2,756,103 Selling and distribution expenses (32,002,783) [37,522,166) (7,207,734) (11,587,121) Administrative expenses (35,997,008) (27,060,280 (12,601,060) (7,438,391) Other expenses (7,655,695 (7,979,608) (802,724) (84.496) Results from operating activities 75,509,037 77 344,917 36,942,081 47.483 933 Finance income 20 1,266,915 228,033 2,502,736 62,663 Finance costs 21 (11,091,593) (9.984,341) (8,124,598) (4,414,959) Net finance costs 9,824,678) 9,756,308 5,621,862) 4,362,296) Profit before tax 65,684,359 67,588,609 31,320,219 43,121,637 Tax credit/(expense) - Current tax and deferred tax 2,390,954 (9,052,257) (1,871,310) (2,343,000) - Additional tax for prior years 22.1 (25,708,582) - Reversal of tax 22.1 10,490,033 Total tax credit/(expense) 22 12,880,987 34,760,839) (1,871,310) 2,343,000) Profit for the year 23 78,565,346 32,827,770 29,448,909 40,778.637 Other comprehensive (expense)/ income, net of tax Items that are or may be reclassified subsequently to profit or loss Foreign currency translation differences/ Other comprehensive (expense)/ income for the year [1,460,084) 10 061,944 Total comprehensive income for the year 77,105,262 42.889,714 29,448.909 40,778.637 Profit/(Loss) attributable to: Owners of the Company 79,886,892 36,228,078 29,448,909 40,778.637 Non-controlling interests 1,321,546) (3,400,308 Profit for the year 78,565,346 32,827,770 29,448.909 40,778.637 Total comprehensive income/ (expense) attributable to: Owners of the Company 78,472,477 45,353,427 29,448,909 40,778.637 Non-controlling interests [1,367,215) (2,463,713) Total comprehensive income for the year 77,105,262 42,889,714 29,448,909 40,778.637 Basic earnings per ordinary share (sen) 24 4.87 2.27 The accompanying notes form an integral part of the financial statements. 136
Step by Step Solution
There are 3 Steps involved in it
Step: 1
Get Instant Access to Expert-Tailored Solutions
See step-by-step solutions with expert insights and AI powered tools for academic success
Step: 2
Step: 3
Ace Your Homework with AI
Get the answers you need in no time with our AI-driven, step-by-step assistance