Answered step by step
Verified Expert Solution
Question
1 Approved Answer
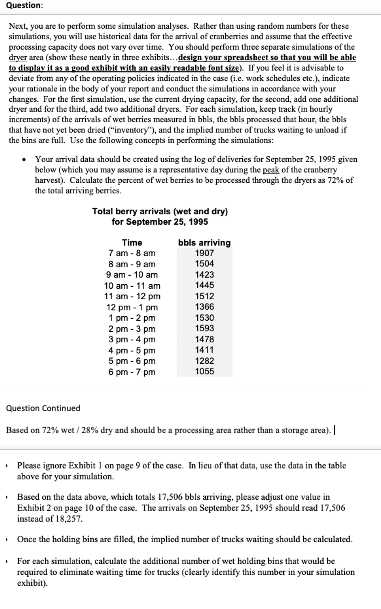
Question: Next, you are to perform some simulation analyses. Rather than using random numbers for these simulations, you will use historical data for the

Question: Next, you are to perform some simulation analyses. Rather than using random numbers for these simulations, you will use historical data for the arrival of cranberries and assume that the effective processing capacity does not vary over time. You should perform three separate simulations of the dryer area (show these neatly in three exhibits...design your spreadsheet so that you will be able to display it as a good exhibit with an easily readable font size). If you feel it is advisable to deviate from any of the operating policies indicated in the case (i.e. work schedules etc.), indicate your rationale in the body of your report and conduct the simulations in accordance with your changes. For the first simulation, use the current drying capacity, for the second, add one additional dryer and for the third, add two additional dryers. For each simulation, keep track (in hourly increments) of the arrivals of wet berries measured in bbls, the bbls processed that hour, the bbls that have not yet been dried ("inventory"), and the implied number of trucks waiting to unload if the bins are full. Use the following concepts in performing the simulations: Your arrival data should be created using the log of deliveries for September 25, 1995 given below (which you may assume is a representative day during the peak of the cranberry harvest). Calculate the percent of wet berries to be processed through the dryers as 72% of the total arriving berries. Total berry arrivals (wet and dry) for September 25, 1995 Time bbls arriving 7 am - 8 am 1907 8 am - 9 am 1504 9 am - 10 am 1423 10 am - 11 am 1445 11 am-12 pm 1512 12 pm-1 pm 1366 1 pm-2 pm 1530 2 pm-3 pm 1593 3 pm-4 pm 1478 4 pm - 5 pm 1411 5 pm - 6 pm 1282 6 pm - 7 pm 1055 Question Continued Based on 72% wet / 28% dry and should be a processing area rather than a storage area). | Please ignore Exhibit 1 on page 9 of the case. In lieu of that data, use the data in the table above for your simulation. Based on the data above, which totals 17,506 bbls arriving, please adjust one value in Exhibit 2 on page 10 of the case. The arrivals on September 25, 1995 should read 17,506 instead of 18,257. Once the holding bins are filled, the implied number of trucks waiting should be calculated. For each simulation, calculate the additional number of wet holding bins that would be required to eliminate waiting time for trucks (clearly identify this number in your simulation exhibit).
Step by Step Solution
There are 3 Steps involved in it
Step: 1

Get Instant Access to Expert-Tailored Solutions
See step-by-step solutions with expert insights and AI powered tools for academic success
Step: 2

Step: 3

Ace Your Homework with AI
Get the answers you need in no time with our AI-driven, step-by-step assistance
Get Started


