

Answered step by step
Verified Expert Solution
Question
1 Approved Answer
Question One Use the Consumer Figures Case Study numbers (in the Word doc) and determine from an overall profitability standpoint, which is better: The starting
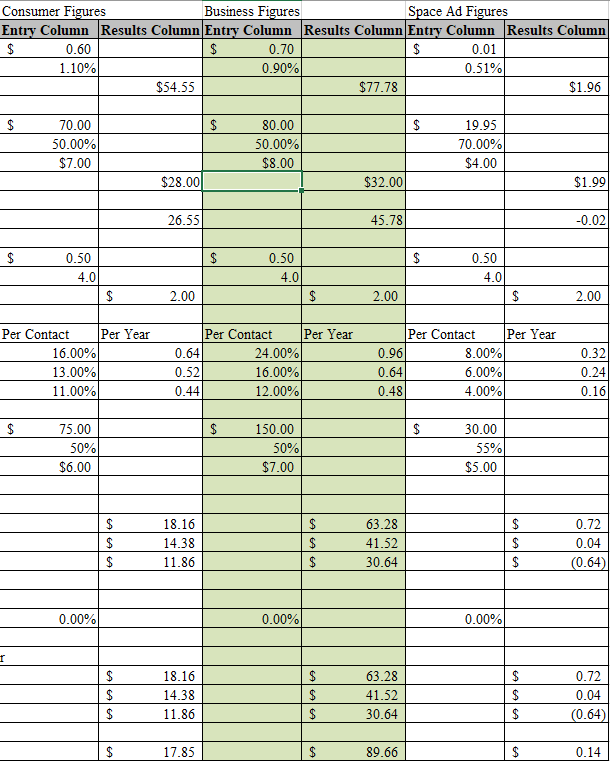 Question One Use the Consumer Figures Case Study numbers (in the Word doc) and determine from an overall profitability standpoint, which is better:
-
- The starting numbers in the case
- OR
- An offer of 2 Honeybell Cheesecakes for $79.00 with the following changes
- 1.05% Average Response, 50% COGS, $8.00 Fulfillment, and Response per Year of 16%, 13%, and 11% (No other changes)
OR
- An offer of 2 Honeybell Cheesecakes for $70.00 with the following changes
- 1.15% Average Response, 55% COGS, $8.00 Fulfillment, and Response per Year of 17%, 14%, and 12% (No other changes)
Step by Step Solution
There are 3 Steps involved in it
Step: 1

Get Instant Access to Expert-Tailored Solutions
See step-by-step solutions with expert insights and AI powered tools for academic success
Step: 2

Step: 3
Ace Your Homework with AI
Get the answers you need in no time with our AI-driven, step-by-step assistance
Get Started
Financial Accounting For Undergraduates
Authors: Wallace
4th Edition
1618533088, 9781618533081