

Question
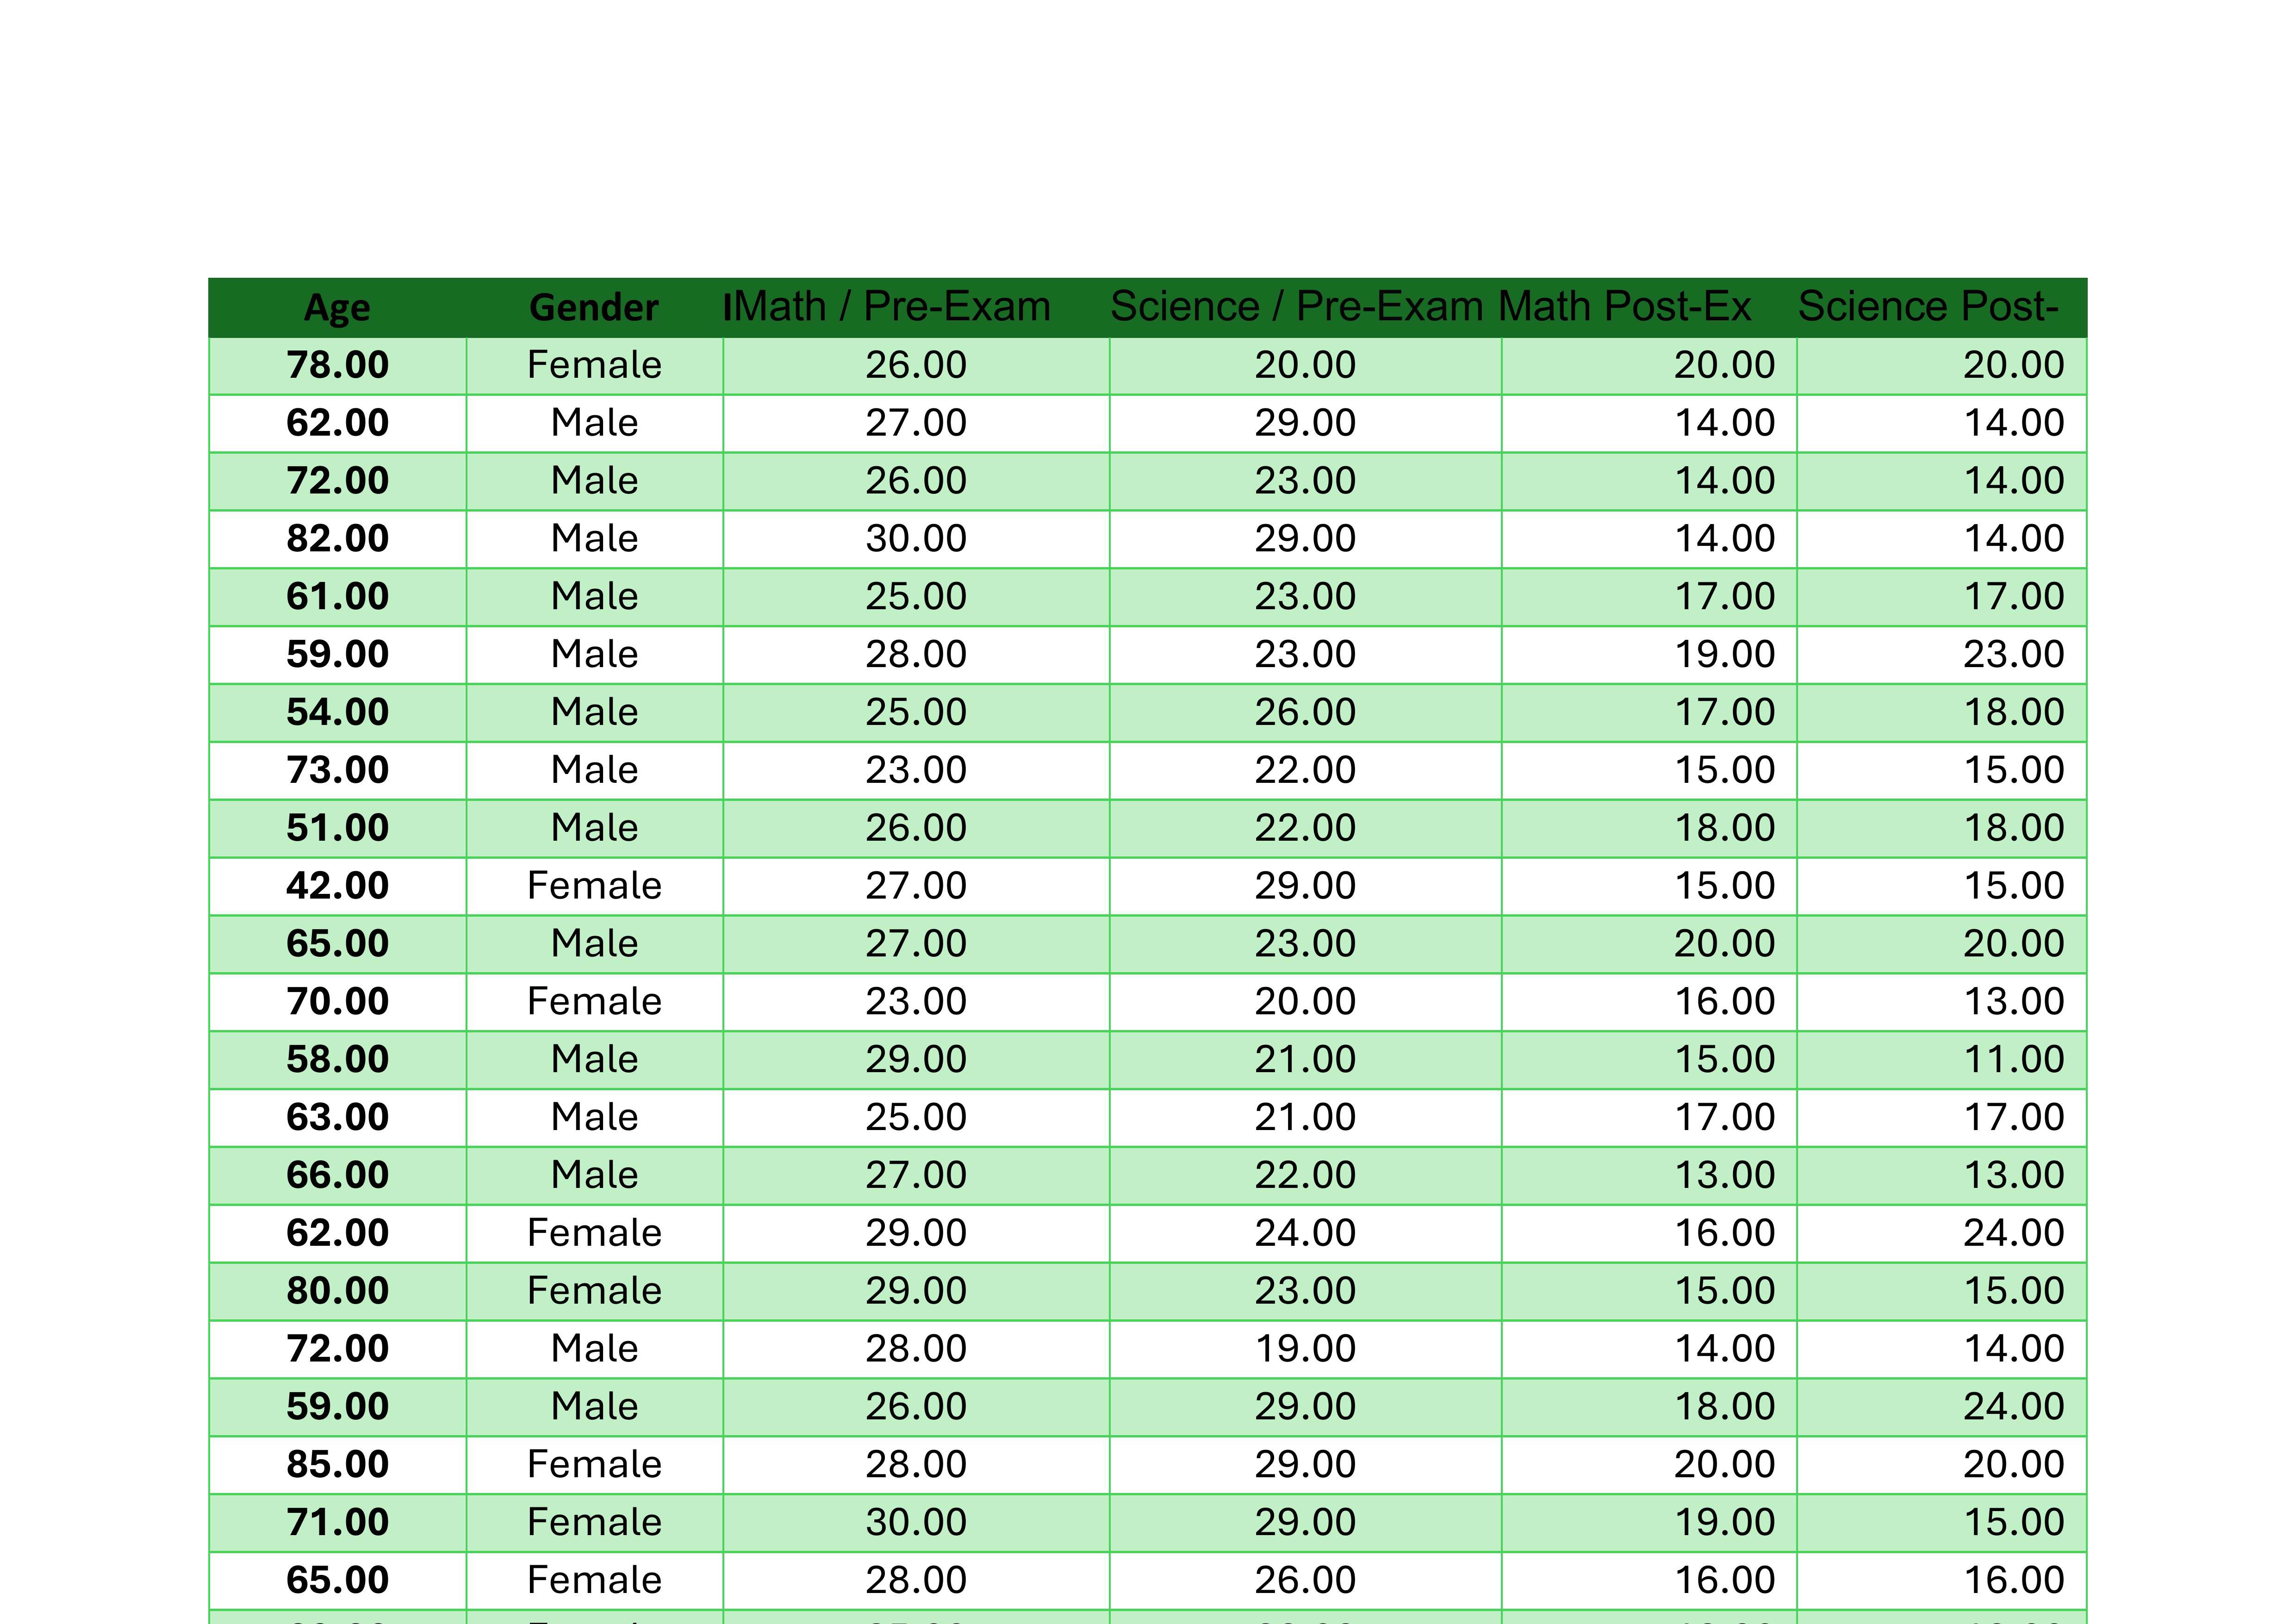
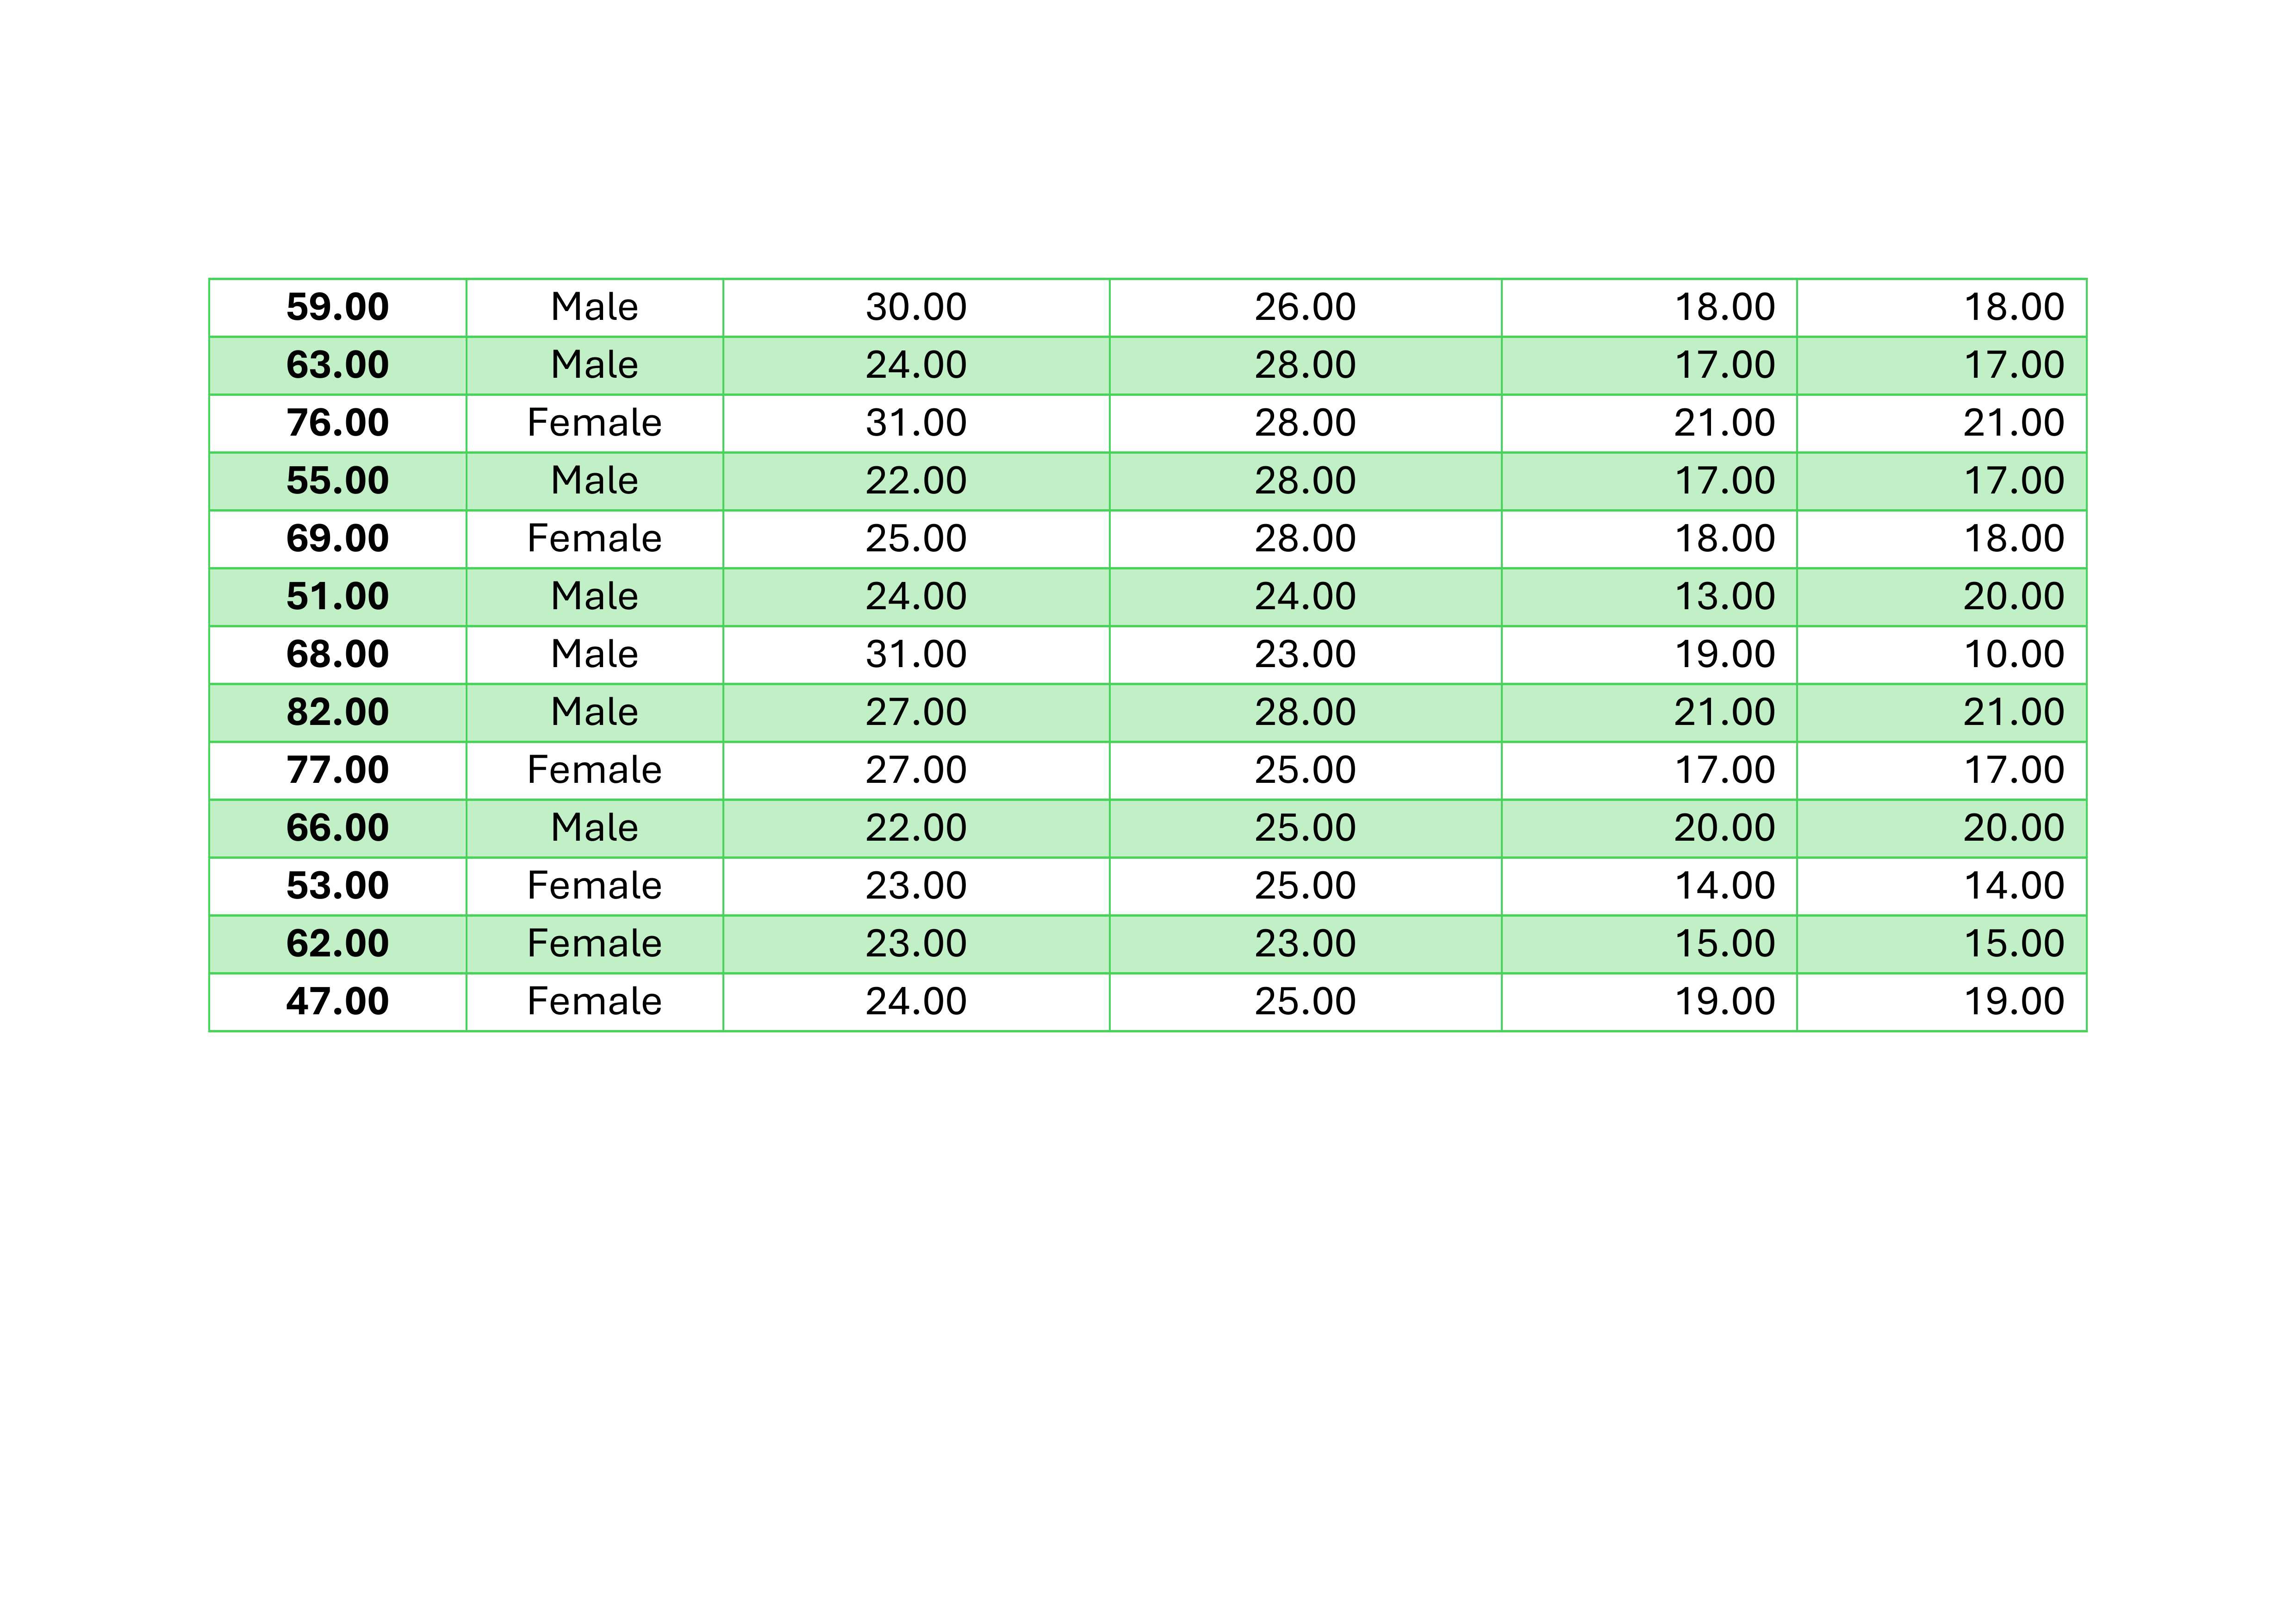
Question paper: Draw histograms of the age of the students, the level of stress experienced by students for math class and science class before the
Question paper: Draw histograms of the age of the students, the level of stress experienced by students for math class and science class before the exam and the level of stress experienced by students for math class and science class after the exam. For the age histogram use a range of 40-90 years as the x-axis and a binning custom interval width of 5.5 years; for the stress levels exhibited before and after the exam histograms use an x-axis range of 20-35 and a binning custom interval width of value 1. - Which of these are normally distributed and which are not? State why based on solely on the data in the histogram - Calculate the mean and SD / median and IQR for the age of the patients and the levels of stress for math AND science prior to the exam. Summarise your findings. - Represent the proportions of male and female students using an appropriate graph - Compare the levels of stress exhibited by math students prior to the exam and after the exam was completed. Did the exam have an effect on the students after the exam was completed? - Assess if age affected the levels of stress of science students before the exam and summarise the results - Plot & present the mean calculated of male vs female students and their stress levels prior to the exam in science class using a bar chart (include +/- 2 standard errors and value labels). Discuss the similarities or differences between males and females.
Step by Step Solution
There are 3 Steps involved in it
Step: 1

Get Instant Access to Expert-Tailored Solutions
See step-by-step solutions with expert insights and AI powered tools for academic success
Step: 2

Step: 3
Ace Your Homework with AI
Get the answers you need in no time with our AI-driven, step-by-step assistance
Get Started
Linear Algebra With Applications
Authors: W. Keith Nicholson
7th Edition
978-0070985100, 70985103